Add API pollers in SAM
Here is an overview of steps involved in adding an API poller:
- Provide details about your new API poller:
- Select a request method: GET or POST.
- Configure a name and description for the API poller.
- Provide the URL of the external API.
- Specify the type of authorization used by the API.
- Enter credentials, if required by the API.
- Send an initial API to retrieve a list of available metrics.
- Select the values you want to monitor:
- Review the API response to determine which metrics are available.
- Select the metrics you want to monitor.
- Assign SolarWinds Platform Web Console display names for returned to metrics.
- (Optional) Configure warning and/or critical thresholds.
- Save your new API poller.
See the SAM API Poller Template Guide to learn about out-of-the-box templates for Microsoft 365, Azure, SolarWinds, and other APIs.
Before you begin
-
Review API poller requirements. For example, you'll need to specify an existing node.
- If your organization hosts applications that you want to access via API, some applications must be configured to allow access to data for API calls. For example, if your organization uses Azure applications accessed via the Microsoft Graph API, you may need to consult with your Azure Administrator to obtain credentials with the proper scope and permissions to the API, such as Group.Read.All and Directory.Read.All. To learn more, see API poller authorization and authentication.
For tips on locating Azure credentials such as Tenant IDs, see Find Microsoft Azure credentials.
Create an API poller for a node
-
Click Settings > All Settings > Manage API Pollers.
-
When the Manage API Poller page appears:
-
Click New.
-
Click the row for the node where you're adding the API poller.
-
Click Create API Poller.

-
-
At the top of the API Poller page, select a Method for the request. The default is GET, which retrieves data from an external API.

-
Enter the Request URL of the API.
You can use macros in request URLs; for example,
https://post-man-echo.com/get?ipAddress=${IpAddress}.For APIs that do not require authentication, skip ahead to step 8 and click Send Request.
-
Click Configure to open the API Poller settings dialog box.
-
Provide a Name and (optional) Description.
If you do not add a name for an API poller, related data will not appear in Performance Analysis (PerfStack) dashboards.
-
(Optional) Disable SSL certificate verification.
SAM checks for a valid SSL certificate during API requests, by default. For remote API servers without valid certificates, disable this option.
-
(Optional) Enable existing SolarWinds Platform settings for proxy servers.
-
(Optional) Set a custom polling interval.
-
Select the Authorization used by the API.
-
Provide credentials, if required by the API.
You can add API credentials on the Manage Credentials page. For API pollers created in earlier versions, recreate credentials on the Manage Credentials page and then edit API pollers to use the new credentials.
-
Click Save.

-
-
If the API requires specific details in the header (for example, credentials), add them. Click + to add multiple headers.
Headers are not encrypted; they're stored in the database as plain text.

-
Click Send Request.
This initial API request is sent from the web. Afterward, API polling occurs via the Main Polling Engine (usually the SolarWinds Platform server) or an Additional Polling Engine, depending on the node configuration.
In the Response pane, a Monitor (
 ) icon appears next to each metric you can monitor. Click Expand (
 ) to show additional metrics that can be monitored. The following example shows that 13 more metrics are available.
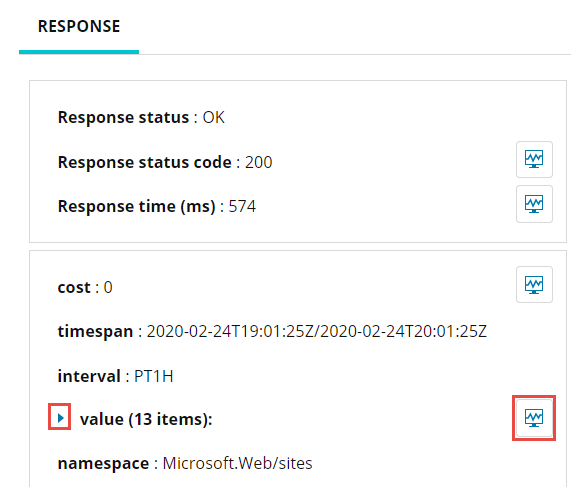
A Response status code other than 200 indicates the request failed. Verify API poller settings, make sure the external API URL is available, and click Send Request again. See also Troubleshoot API pollers in SAM.
-
For each metric you want to retrieve, click the Monitor (
) icon to open the following dialog box.
-
Leave "How should we store this value?" set to "New monitored value" to add only the current metric.
Select "Use as a variable in subsequent request" to use the value for this API poller only. It will not be stored in the database or consume a SAM license. This is useful for APIs that require authentication tokens in headers; the first request retrieves a token that is then passed to subsequent requests as a variable in headers. See Chain multiple API requests in a single API poller in SAM for details.
-
Enter an SolarWinds Platform display name for the metric.
-
For Type, the default value is Numeric. If necessary, change it to String and then use the extra fields that appear to map string values to numeric values. For example, map "True" to 1 and "False" to 2. See API poller alerts for details.
-
(Optional) Set Warning and/or Critical threshold values. See API poller alerts for details.
-
Click Save.
-
-
When finished selecting and configuring values to monitor, click Save to finish creating the API poller.
If errors occur when saving an API poller, review OrionWeb.Log and ApolloWebApi.log files.
When you return to the Node Details view, wait 2 minutes for polling to occur. When monitored metrics appear in the API Poller widget, you can: