Identify and troubleshoot a node that has a problem
By default, devices monitored by NPM are polled for data every nine minutes. It might take some time before all the nodes you added have data you can review.
Step 1: Determine there is a problem
The easiest way to identify a problem is to have an alert notify you.
Some alerts are enabled by default, such as the Node Down alert. Therefore, if a node goes down (that is, it does not respond to a ping), you will see it immediately in the Active Alerts widget on the Home page.

Down nodes appear in widgets as red (down) or yellow (warning).

If you have configured your alerts to send email, you get an email when a node goes down.
If you do not see any alerts, click My Dashboards > Network > Network Top 10.

The widgets on this page help identify nodes that respond to a ping but have other health problems.

Step 2: Get more details about the node
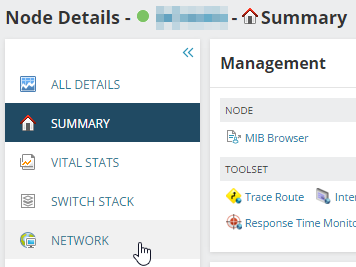
When you find a node with a problem, click the node name in any widget to open the Node Details page.
If a node is down (red), this means it does not respond to a ping. To resolve an issue of this severity:
-
Check the power. Is it plugged in?
-
Check the LAN link light. Is it connected to the network?
- Log in to the device and begin troubleshooting it.
If a node responds to a ping but shows signs of health or performance issues, use the information on the Node Details page to help troubleshoot.
-
Check the Response Time, Packet Loss, CPU load, and Memory Utilization widgets. Usually, those statistics are the first indicators of a problem. In our example, the CPU load on this node is high.

-
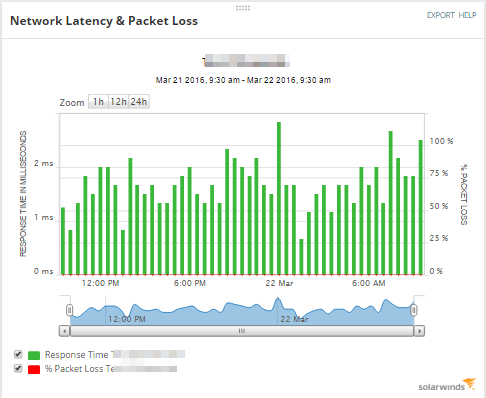
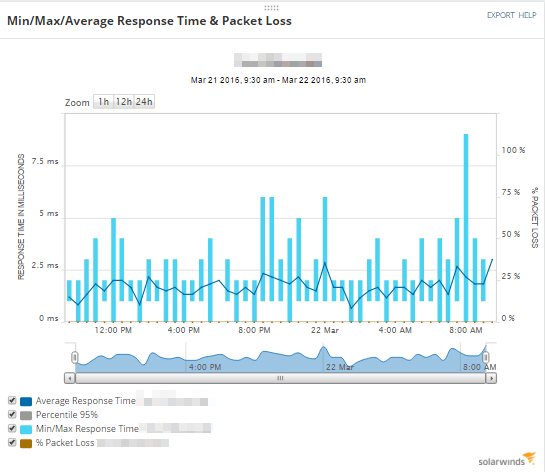
Use the Network Latency & Packet Loss, as well as the Min/Max/Average Response Time charts, to see if this is a momentary problem or a continuing issue.
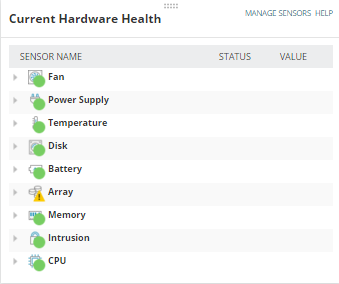
- Depending on what type of node you are monitoring, you may see additional widgets specific to that type of device. For example:
Hardware health: Reports on physical elements of the hardware for Cisco, Dell, F5, HP, and Juniper.
Routing table information: For routers and switches, multiple widgets show a variety of route-related information. Look under the Network subview for routing widgets, such as Routing Neighbors, Routing Table, or Default Route Changes.
Step 3: Get more details about the alert
When a problem causes an alert to be triggered, that alert appears on the Node Details page in the Alerts for this Node widget. Click the alert name to go to the Alert Details page. Use the widgets on this page to investigate the cause of the alert.