Configure table widgets for modern dashboards
This topic applies to all SolarWinds Platform products.
 Watch this video:
 Table widgets display data or information in a tidy grid format. You can use them on modern dashboards.
How to configure table widgets
- Specify the title and other details for the widget.
- Define data to be displayed.
- Customize columns for the table: click Add new column.
- Customize sorting and add search bar (optional, done in Presentation).
- Save Changes.
See Edit widgets for details on resizing widgets, changing widget position, or deleting widgets.

Step 1: Specify the title and other details for the widget
-
In Presentation, expand Title and Description.
-
Provide the title and subtitle.
-
If you want to have a link with other information about the widget, provide it in the Widget link URL.
-
You can also provide a description that might help others to reuse the widget.
-
You can also set how often you want data in the widget to refresh. See Refresh rate.
-
To make the widget header hidden by default, select the Collapsible box. To expand the header on the widget, click the line on the top of the widget. To hide the header again, click the arrow signs.
Step 2: Define the data to be displayed
-
Expand Data and Calculations.
-
Define the data model with the graphical query builder or manually.
Use the graphical builder
-
Select Use the graphical query builder and click Edit.
-
Select the entity you want to display metrics for and click Next.

-
Drag columns that contain the raw data you want to see in the widget.

-
To display entities with specific values for one of the defined columns, click Add a filter and specify the values to be included.
You can only filter data from the original table. To use more complex filters, such as filtering data from joined tables, define the data Manually using SWQL.
-
See your current settings in the Model preview.

-
When you are satisfied with the preview, click Save model. Your settings are displayed in the data model and in the widget preview.

Manually
-
Select Hand-edit a SWQL Query and click Edit.
-
Copy the following query into the SWQL query field and click Save model.
SELECT TOP 25 COUNT(e.EventID) as value, t.Name as type
FROM Orion.Events e JOIN Orion.EventTypes t ON e.EventType = t.EventType
GROUP BY type ORDER BY value DESC
-
Step 3: Customize columns for the table
Columns mentioned in the Data model section are added automatically.
To add columns:
- Click Add new column.
- Expand Description and provide the label for the column. You can also specify a fixed width for the column or hide the column.
- Expand Property and formatting and specify the format for displayed data:
Option Description Example No format Displays the value as is.
Link Displays the value as a link. You need to specify the URL and the label to use links. Simple number Displays numeric values. You can optionally prefix it with an icon and add text at the end.

Status label Automatically maps numeric value on Orion Status. 
Threshold Value Shows numeric value together with metric (%, ms, ...) defined by selected threshold and linear bar chart (optional). The icon and color of value change, when exceeds specific threshold level. 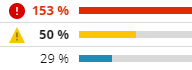
Orion Entity Displays Orion entities as a clickable link with additional icon and entity status. You can either select the icon manually or use a vendor icon. 
- When finished, save the changes.

Step 4: Specify sorting, search, and pagination for table widgets (optional)
By default, the table is sorted by the value in the first column, in ascending order.
Customize sorting
-
In Presentation, expand Sorting, and select the column to sort by in the drop-down.
The values in the drop-down are labels you specified for your columns.
-
To sort in descending order, select the Descending box.

Add a search box for the table widget
In Presentation, expand Search, and switch on the Enable toggle. This adds a search box at the top of the table widget. You search for data displayed in any of the columns.

Customize pagination and scrolling
Specify the behavior for displaying long lists of items in the table. Select the number of items per page or the scrolling type to be used.
In Presentation, expand Scroll type.
Select the behavior for long lists and save the changes.
-
Virtual scroll: Use a scroll bar or the mouse wheel to scroll. This option loads rows gradually to reduce the load on the browser and improve performance. When you reach the end of displayed information, additional rows will be loaded.
-
Paginator: Specify the number of rows to be displayed on each page. If there are more page available, you can navigate between them using the shortcuts below the table.
-
Default scroll: Use a scroll bar or the mouse wheel to scroll. This option loads all data at once, which can be more resource-intensive.