Inspector
To access the Inspector, click Databases > Inspector. The Inspector combines Profiler and system charts data. Use the Inspector to compare Profiler data directly with system metrics such as MySQL Queries, MySQL Query latency, or MySQL Activity. For example, you could use the Top 10 Databases by Total Time chart, and compare that to the MySQL Queries, and MySQL Activity charts to see which of your MySQL databases is experiencing the highest load and requires optimization.
The Inspector opens to an empty page with two drop down bars. The left search bar is for Profiler charts, and the right search bar is for system charts. Add profiler datasets and system metrics charts to compare data sets and thoroughly inspect your database environments.
Add a profiler dataset
Click in the left search bar to select a Profiler chart. Profiler charts will be displayed as The Top 10 profiler category by Total time by default. For example, click queries from the Profiler search bar to display the Top 10 Queries by Total Time. Click the Settings funnel to adjust the Profiler chart. You can adjust the chart to rank from the top 10 - 50, and by any of the Profiler ranking options.
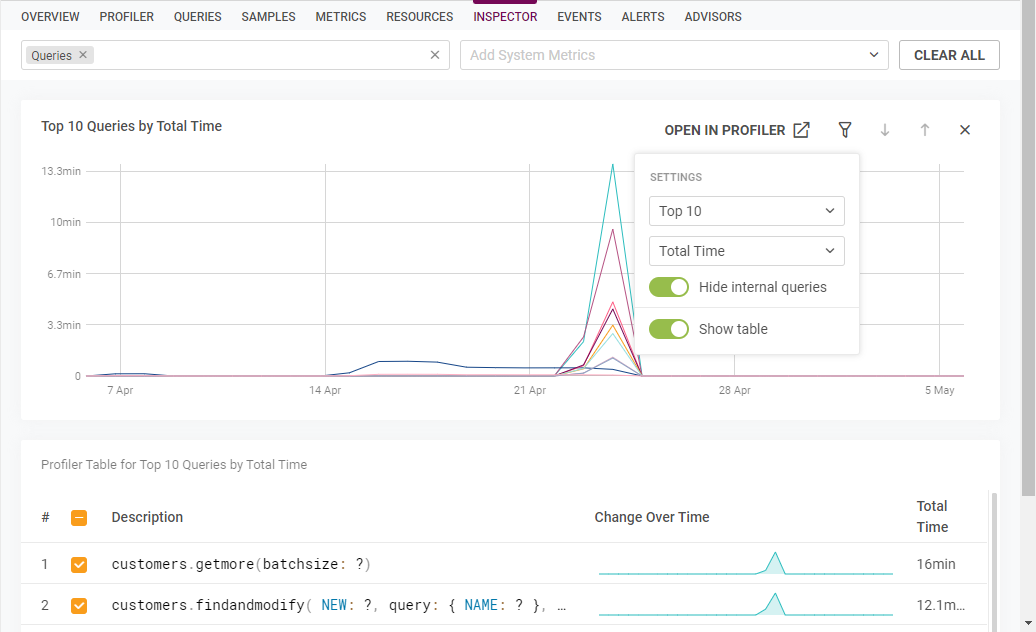
In a Profiler dataset, click Settings > Show table to display the Profiler chart details in the table view. Click an option within the table to remove that option from the Profiler chart. Removing options from the chart can help you to isolate specific patterns and better identify indicators for optimization. Click Settings > Hide internal queries to hide any queries used by SolarWinds Observability SaaS for database monitoring.
You can also Click Open in Profiler to open any Profiler chart in the Profiler, and click Export to CSV to quickly save your results to a CSV file.
You can display Event Markers at the bottom of the Profiler chart.
View in-depth query details
In any profiler query dataset, you can click a query from the profiler table to open Query details for your selection. Click the desired query in the table to open the query preview and then click View details to continue to the Query details overview.
Add a system metric chart
Click in the right search bar to select system metric charts. Rank system metric charts such as MySQL Queries, MySQL Query Latency, and MySQL Activity to display the respective charts for the set time period. Compare the data from the selected system charts and Profiler datasets to identify troublesome queries, periods of downtime, or other database related issues.

Click the X at the top right of a chart to close the chart.
Clear the Inspector
Click the Clear All button to remove all Profiler data sets and system metrics charts from the view.
Share Inspector data
Share your current Inspector view with other stakeholders.
-
Click the share button
 .
. -
Click the Include Time Range toggle to include the current time range. Note that the current time range is not included by default.
-
Click the clipboard button
 to copy your Inspector link.