Draw horizontal lines in SolarWinds Platform widgets
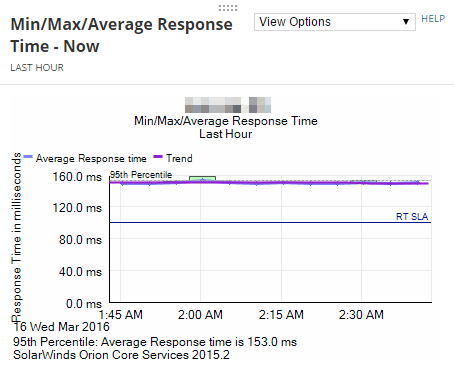
Customize charts for specific objects to include a horizontal line that marks certain values. For example if you have an SLA that requires response time on a key interface to stay below certain value, you can draw a line into the response chart which marks the value that should not be exceeded.
This is possible for most charts, such as availability charts, response time, CPU load, memory, percent memory, or buffer charts.
You can use lines to control the upper end of the y-axis. Set the [metric name]_Marker value at the required high value and set no label. The chart will always go at least to the defined value, regardless of the data.
- Create two custom properties for nodes based on property templates:
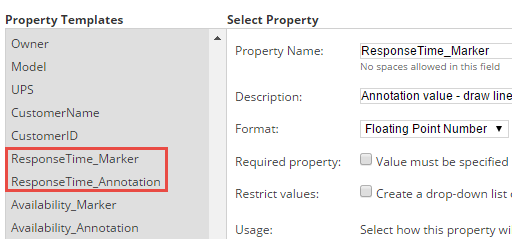
- [metric name]_Marker, for example ResponseTime_Marker, designating the value where the line will display.
- [metric name]_Annotation, for example ResponeTime_Annotation, provide a label for the line.
- In Property Templates, select [metric name]_Marker.
- On Assign Values, select the objects, and provide values for the line.
- Create the [metric name]_Annotation custom property based on the template, select the objects, and provide the label for the line.
When you now go to the details view for the node and consult the Response time graph, you will see a labeled line signifying the selected value there.