Troubleshoot intermittent network slowdowns
This topic provides an example of how you can troubleshoot an issue where a router drops or delays packets. Bandwidth issues are already ruled out.
This example describes creating a Performance Analysis dashboard (PerfStack™) that correlates the following metrics to investigate the cause of the network slowdown:
- Average Response Time (ms) and Percent Loss to assess the symptoms of the problem: how fast is the network getting your traffic to the server and how much of your traffic is lost.
- Average CPU Load and Average Percent Memory Used to verify whether the system-wide resources are not overloaded and thus causing the issue.
- Buffer Misses due to No RAM and Total Number of Buffer Misses to see if high RAM usage impacted how the router allocates RAM for traffic forwarding.
- Small, Medium, Big, Large, and Huge Buffer Misses to investigate which size packets are causing the generic buffer misses you found.
To troubleshoot the network slowdown:
- Click My Dashboards > Home > Performance Analysis.
- Click Add Entities, add the node to the Metric Palette, and select the node.
-
Expand the Response Time History metric group, and drag Average Response Time and Percent Loss to a new chart.

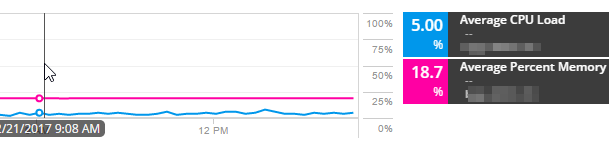
- To investigate the load, add Average CPU Load and Average Percent Memory metrics to a new graph. Add the memory load in percent to be able to compare the two metrics.
In this example, the CPU load is low (about 5%). The used Average Percent Memory is 18.7%, and so it is not the cause of the issue. The issue might be caused by the allocation of buffer for sending packets.
- Investigate whether it is a buffer issue:
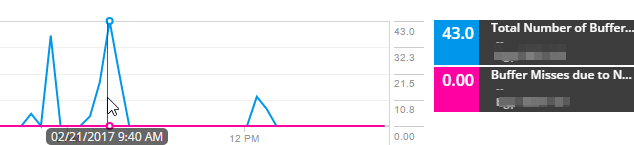
- Add the Total Number of Buffer Misses to a new graph. In this scenario, there are spikes in the Total Number of Buffer Misses graph.
- To find out whether they are caused by a lack of RAM, add Buffer Misses due to No RAM to the Buffer Misses chart.
In this example, Buffer Misses due to no RAM are zero, so insufficient RAM is not the cause of the spikes in buffer misses.
- To investigate the buffer misses, add metrics for all types of buffer misses into a new graph.
The following example shows the size of the packets that are being dropped.
In this scenario, all buffer misses values are zero except for small buffer misses. Small buffer misses are thus the cause of the issue. To resolve the issue, increase the buffer size for small buffers, or configure the router to have a larger boundary.
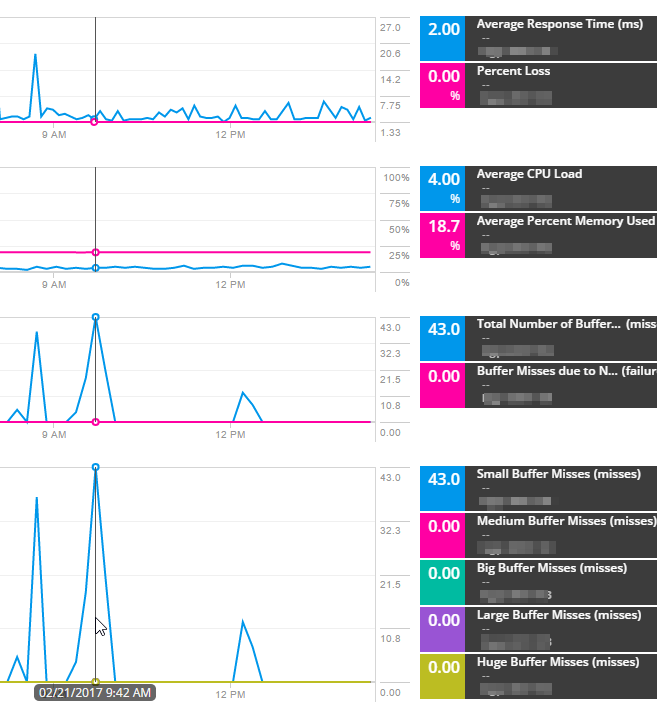
The graph shows that both average response time and percent packet loss are low. The response time ranges from 2 to 7 ms.

- To share the dashboard, simply share the URL. The URL contains all data to recreate the view.
- To keep the featured metrics in the dashboard for later use, click Save and enter a name for the Performance Analysis project. You can click Load to view the project again.