Configure timeseries widgets for modern dashboards
This topic applies to all SolarWinds Platform products.
 See this video: A Step-by-Step Guide to Building Modern Dashboards on the Orion Platform ‚ SolarWinds Lab #93.
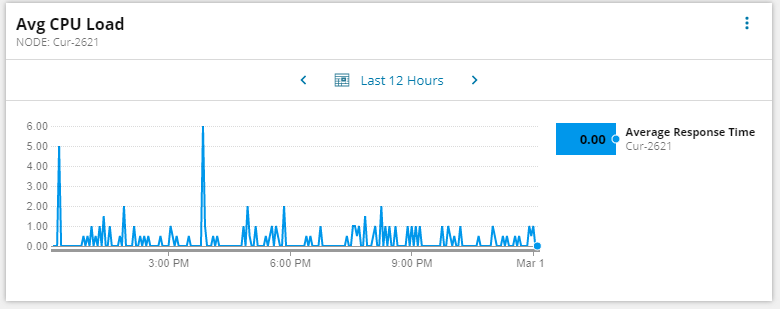
The timeseries widget displays a PerfStack project as a line chart on your new dashboard. You can use them on modern dashboards.
How to configure timeseries widgets
- Configure title and other details.
- Configure the time to be displayed on the widget (optional).
- Select a PerfStack project for the widget.
- Save Changes.
Step 1: Configure title and other details
-
In Presentation, expand Title and description.
-
Provide the title and subtitle.
-
If you want to have a link with more details on the widget, provide it in the Widget link URL.
-
You can also provide a description that might help others to reuse the widget.
-
Starting with Orion Platform 2020.2.5, you can also set how often you want data in the widget to refresh. See Refresh rate.
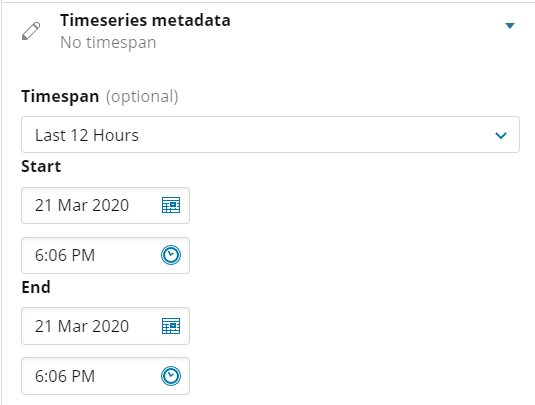
Step 2: Configure timeseries metadata
If you want to see a different timespan than the default one, expand Timeseries metadata and customize the time.
Step 3: Select the PerfStack project to display.
-
Expand Data model and click Edit model.
-
Select a PerfStack project and click Save.
The PerfStack project now displays on the dashboard.