Analyze historical data
The Historical Events and Report screen allows you to locate all event data that passed through a particular SEM Manager instance. Use this screen to perform custom searches, investigate your search results and event data, and identify trends in your network.
You can use the Historical Events screen to:
-
Apply query tags and thresholds
Because some search parameters can result in several matching results and negatively impact SEM performance, SEM limits the number of events that are retrieved. See Event Limits for more information.
Historical Events and Reports screen
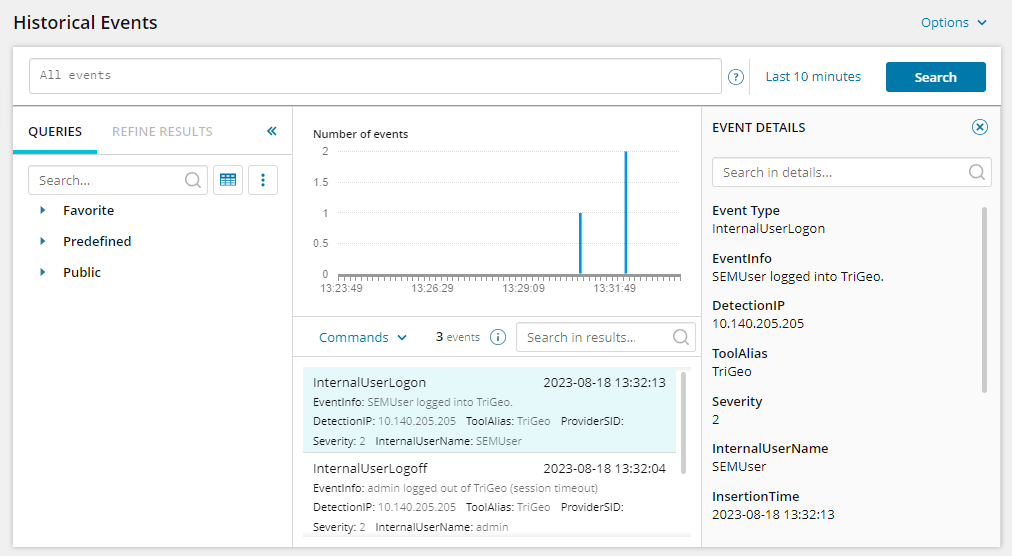
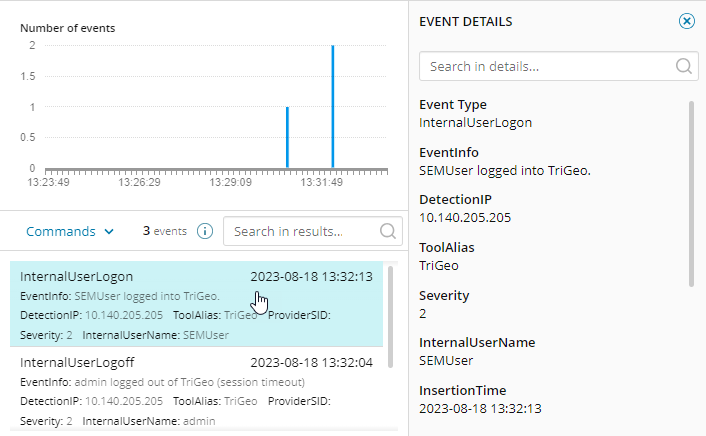
Log in to the SEM console and click Historical Events & Reports in the toolbar. This screen displays the unfiltered events for a specific period of time (such as the last 10 minutes) in graphical and list format.
The following example displays the results for a selected event (highlighted in blue).
This screen includes the following features:
Query Builder
The Query Builder helps you create queries to filter the normalized historical events. Enter a query in the field and then click Search to run the query. See Create a search query for information about creating queries.

After you create a query, you can apply tags to queries so they can be grouped for use with the Scheduled Query Severity and Scheduled Query Table Severity widgets on the SEM dashboard.
Time Picker
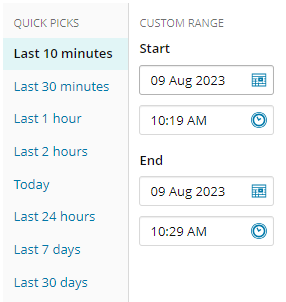
The Time Picker allows you to select a time period for the query. Click the time period link (for example, Last 10 minutes) to display results for your selected time period. You can use preset "quick picks" or create your own custom periods.
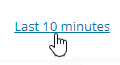
When you click the link in the toolbar, you can refine your search results with the custom time picker. You can select a quick pick, or set a specific date and time range.
Query options
After you create a query, click Options in the toolbar to save the query, save and schedule the query, or generate a query report.
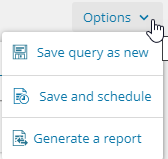
The following table describes the query options.
| Selection | Definition |
|---|---|
| Save query as new |
Saves the current query with a user-supplied name. When you are finished, the query will be available from the Queries tab in the Public drop-down menu. After you save a new query, click Options in the toolbar and select Edit saved query in the drop-down menu. When you edit a query, you can change the query name, add a tag, and modify the thresholds used to determine the severity level and colors on the Dashboard overview widgets. |
| Save and schedule |
Runs the currently viewed query at specified dates and times. When you click this option, you can provide a name for the query and schedule the query search. You can have the results emailed to selected email addresses and LDAP users or used in Scheduled Query Severity dashboard widgets. See Schedule a search query for details on how to schedule a search query. |
| Generate a report |
Generates a query report. See Generate a query report for details on how to generate a report. |
Queries and Refine Results tabs
The Queries and Refined Results tabs in the left column allow you to switch between your list of saved historical event queries and refined results.
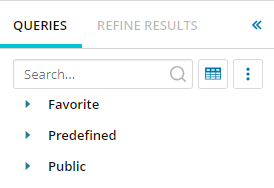
Queries tab
The Queries tab in the left column lists your saved historical event queries. All historical event queries are divided into four categories: Favorite, Predefined, Public and User-created, as shown below.
The following table describes the Queries tab categories. See Create a search query for details about creating queries.
| Category | Description |
|---|---|
| Favorite | Lists queries that were created in other categories but marked by you as favorites. |
| Predefined | Lists the most commonly required queries. |
| Public |
Lists queries that can be used by any SEM user in your deployment |
| User-created |
Lists all queries created by you for your own use and are not accessible or editable by other users. This category displays in the Queries tab after you create and save a query.
By default, all queries you create are only visible and used by you. However, you can share queries and make them editable. See Manage and load saved search queries for details about managing search queries. |
Query icons
Some saved historical event queries include icons that provide addition information about the query. For example:

The following table describes each icon that provides additional information about the saved query.
| Tag | Description |
|---|---|

|
The saved query is scheduled to run at a specific date and time. The user who created this query can configure the query to automatically send the query results to a selected email address or LDAP user or display the results in the Scheduled Query Severity dashboard widget. The scheduled query widgets are created and customized in the same way as other SEM Dashboard widgets.
|

|
The saved query was created by the current user and shared with everyone. Only the current user can edit the query. |

|
The shared query is read-only and cannot be modified by the current user. The user who shared the query can stop sharing the query at any time. You can copy the shared query. The copied query is moved to the User Defined category where you can rename and edit the query. |

|
The saved query can be edited by anyone. After a query is configured as editable, it cannot be made non-editable or private. |

|
The saved query is a favorite and saved in your Favorite drop-down menu. To copy a query to the Favorite query menu, select the query, click the vertical ellipsis, and select Favorite. To remove a query from the Favorite query menu, select Remove from favorites. |
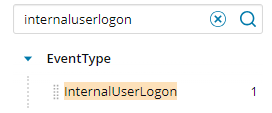
Refine Results tab
The Refine Results tab in the left column lists the fields available for filtering historical events by category. You can drag these fields into the Query Builder field when you create a search query.
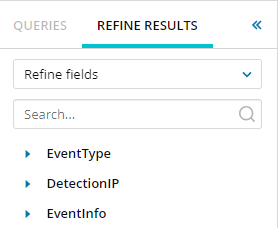
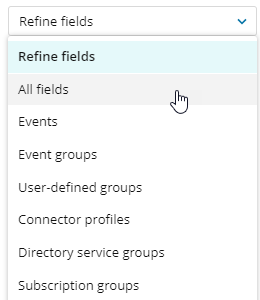
To organize the results by all fields, events, connector profiles, or specific groups, click the drop-down menu and select an option.
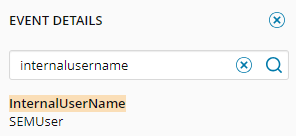
To locate and a historical event, enter an event in the Search box and then click the magnifying glass icon  to display the result.
Events chart
The event chart displays the number of events over the specified period of time as a simple bar chart.
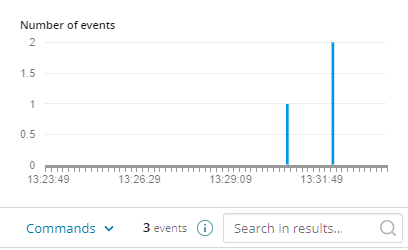
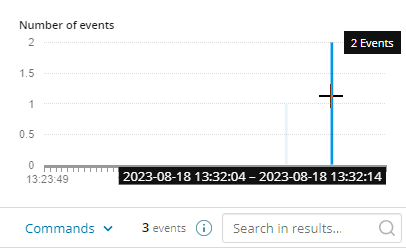
Drag the cursor over a time period to zoom in on that period.
In the toolbar, the Commands drop-down menu provides the following options:
- Click Export to save the filtered events as a CSV file.
- Click Switch to List view to display the filtered events as a list.
- Click Switch to Table view to display the filtered events as a table.
- Click Hide Chart to remove the chart from display.
- Click Show Chart to display the chart.
The toolbar also displays the maximum number of events that meet your query, and allows you to search the event results for a specific event.
Events count
The toolbar also displays the maximum number of events that meet your query, and allows you to search the event results for a specific event.

Click the ![]() icon to view the following:
icon to view the following:
- Number of loaded events
- Maximum number of loaded events
- Number of event found (loaded and not loaded)
Because searches with a high maximum threshold can negatively impact performance, you can set the maximum number of loaded events.
On average, every 1000 returned search results consumes approximately 100 MB of RAM. This can result in up to 10 GB consumed by one search query if the threshold is set to 100,000 maximum results.
Click the information icon to display additional information.
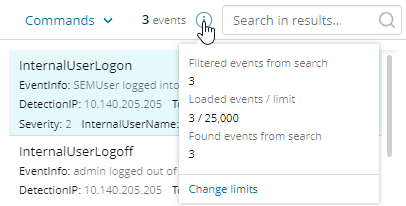
To change the maximum limit, click Change limits. See Set live and historical event limits for more information.
Events details
The Event Details column displays additional information about an event. When you select a single event in the center column, the Event Details column lists the details about the event.
To locate specific details in the event, enter a search term in the search field and then click the magnifying glass icon  to view the results.