Create a custom JMX Monitor in SAM
SAM includes a predefined component monitor, the JMX Monitor, that you can customize at the template level or in individual application monitors.
However, editing templates or application monitors isn't always practical because MBeans can vary widely in different environments. Instead, consider using the Component Monitor Wizard to create a custom JMX Monitor to extract the MBean data you need from target servers. The wizard walks you through each step and provides a list of available MBeans.
Before proceeding, note the following details:
- You may need JMX credentials or none at all, depending on how the Java application server is configured.
- The following SolarWinds Platform features do not support JMX monitoring:
- To set up target servers for monitoring, see Configure Java application servers and JVMs for SAM monitoring.
- The JMX Monitor supports SolarWinds Platform agents for Windows, Linux, and AIX. For Linux servers, see Configure Linux/Unix systems for monitoring by the SolarWinds Platform agent in SAM.
Agentless and SolarWinds Platform agent for Windows polling use the JMX Bridge Service but Linux-based JMX queries run locally through the SolarWinds Platform agent itself. For details, see the JMX Monitoring thread in the Server & Application product forum in THWACK.
- (Recommended) To monitor Apache Tomcat servers, use a template that includes a Tomcat Server monitor, such as the Tomcat Server template.
- Numeric values for the following data types are supported:
- java.lang.Byte
- java.lang.Short
- java.lang.Integer
- java.lang.Long
- java.lang.Double
- java.lang.Float
To monitor string data, consider creating a custom script monitor.
Recommended: Test JMX components individually to avoid heavy loads on agents.
Create a custom JMX Monitor in the Component Monitor Wizard
- Click Settings > All Settings > SAM Settings > Component Monitor Wizard.
- On the Select Monitor Type tab of the wizard, select Java JMX Monitor as the component monitor type and click Next.
- On the Select Target tab, provide details about the target server, and then click Next.
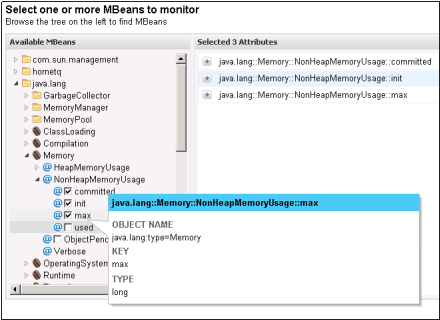
- On the Select Components tab, a list of available MBeans appears. Expand the folders by clicking the arrows (or [+]) to expand the tree view folder structure. Drill down to select the attributes you want to monitor.
- After selecting MBeans to monitor, click Next to complete the remaining tabs in the wizard.
- When finished, click OK, Create to save your new component monitor.

An alternative method: Customize a JMX Monitor manually
If you decide not to use the Component Monitor Wizard to build a custom JMX Monitor, you can adjust values for an JMX Monitor in an existing template or application monitor manually.
Entering the correct information can be complicated and cumbersome. This method is best suited for an administrator who is very familiar with the Java environment.
