Create a time-series widget
You can create interactive time-series widgets view data points at specific time intervals. Use long-term widgets for view a broader range of records (up to seven days). Use short-term widgets to drill down into specific log activity over a designated time.
The long-term widget displays event data for up to the last seven days, but only shows the days with event data. Up to 100,000 events, starting from the last time SEM Manager was restarted, are displayed.
-
On the Dashboard toolbar, click Edit Dashboard.

-
On the Edit Dashboard toolbar, click Add widgets.

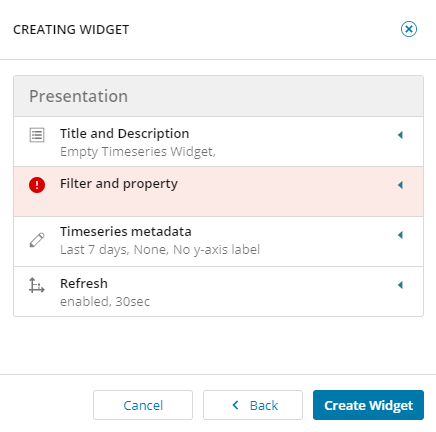
The Creating Widget pane expands displaying a variety of widgets and widget templates.
- Select New Time Series Widget - Short Term*, and then click Customize.

To monitor a broader range of event logs, select the long-term widget.
- Expand Title and Description, and enter a title for the widget (subtitle and description are optional).
- Expand the Filter and property section.
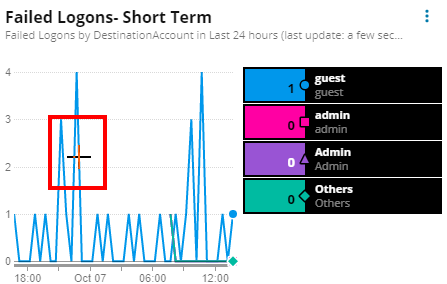
- From the drop-down lists, select the specific event groupings to appear in the widget. For example, if you want to monitor a time line of failed logons, select Failed Logons from the Filters drop-down list, and then select DestinationAccount from the properties drop-down list.
- Click the arrows to set your number of shown groups (between one and 10).
- Expand the Timeseries Metadata section, and select your starting time span, chart legend display option, and then the auto refresh rate.
As you make your changes, the widget preview updates to the left of the widget template.
- Click Create Widget, and then click Save changes.
- To view event logs for a designated time, click a specific point in the chart.

The Events viewer opens displaying associated logs.

