Managing Quality of Experience widgets
Like any widget, Quality of Experience widgets can edited or customized. Following are Quality of Experience widgets.
All Nodes with QoE Traffic
This widget provides a list of all monitored nodes that have QoE traffic. Click [+] to expand a list of the applications that are monitored on a listed node.
To manage the QoE packet sensors that collect QoE data, click Manage.
Modifying the node listing:
- Click Edit, then edit the chart Title and Subtitle, as appropriate.
Leave the Subtitle field blank for automatic grouping.
- Select appropriate options from the following drop-down lists to customize the list of monitored nodes:
- Click Submit.
Application Response Time (Time to First Byte)
The Top 10 Application Response Time (Time to First Byte) widget displays the response time, over time, for the currently viewed application.
Customizing this widget for viewing in the web console:
- From the widget, click Edit, then edit the chart Title and Subtitle as needed.
- Select appropriate values for the Default Zoom Range, Amount of Historical Data to Load, and Sample Interval.
- Click Submit to commit customizations.
Exporting or printing chart data:
- From the widget, click Export, then customize the chart to format it for export.
- Edit the chart Title and Subtitle, as appropriate.
- Select appropriate values for the Default Zoom Range, Time Period, and Sample Interval.
- Resize the chart by selecting appropriate Width (pixels) and Height (pixels).
To maintain the same aspect ratio, enter
0for the Height and vary the Width, as needed. - Click Refresh to review, then click Submit to commit customizations.
- Select the appropriate option on the Custom Chart view.
Application Response Time (Time to First Byte)
The Application Response Time (Time to First Byte) widget displays the response time, over time, for the currently viewed node.
Customizing this widget for viewing in the web console:
- From the widget, click Edit, then edit the chart Title and Subtitle, as needed.
- Select appropriate values for the Default Zoom Range, Amount of Historical Data to Load, and Sample Interval.
- Click Submit to commit customizations.
Exporting or printing chart data:
- From the widget, click Export, then customize the chart to format it for export.
- Edit the chart Title and Subtitle as needed.
- Select appropriate values for the Default Zoom Range, Time Period, and Sample Interval.
- Resize the chart by selecting appropriate Width (pixels) and Height (pixels).
To maintain the same aspect ratio, enter
0for the Height and vary the Width, as needed. - Click Refresh to review, then click Submit to commit customizations.
- Select the appropriate option on the Custom Chart view.
Business Related vs. Social Traffic
Customizing this widget:
- From the widget, click Edit, then edit the chart Title and Subtitle, as needed.
- Edit the chart Title and Subtitle as needed.
- In the Data to Summarize Field, select the type of data by which you want to list productivity ratings (Data Volume or Number of Transactions).
- Select an appropriate value for the Selected Time Period.
This is the time period for which data is displayed in the widget.
- Click Submit to commit customizations.
Changing an Application Productivity Rating
Before you begin:
- Applications are only listed if there are monitored nodes. You must first add a QoE Network or Server Sensor before you can enable any applications.
- Applications listed with the Enabled/Disabled toggle "ON" are currently being monitored on at least one node.
- Applications can be disabled (the Enabled/Disabled toggle "OFF") which means that no traffic for the application is currently collected on any node.
- In the SolarWinds Platform Web Console, click Settings > All Settings > QoE Settings.
- Click Manage QoE Applications, select the application you want to edit, and then click Edit.
- On the Configure Application view, edit the Productivity Rating as necessary, and then click Next.
- On the Configure Data Collection view, choose the node(s) you want to monitor for this type of traffic.
Only nodes already specified as nodes to monitor on the Manage QoE Nodes page appear in this list.
- Click Next, then review your choices on the Summary page, then click Finish.
Data Volume By Application
Customizing this widget:
- From the widget, click Edit, then edit the chart Title and Subtitle as needed.
- Select appropriate values for the Default Zoom Range, Amount of Historical Data to Load, and Sample Interval.
- Click Submit to commit customizations.
Exporting or printing chart data:
- From the widget, click Export, then customize the chart to format it for export:
- Edit the chart Title and Subtitle as needed.
- Select appropriate values for the Default Zoom Range, Time Period, and Sample Interval.
- Resize the chart by selecting appropriate Width (pixels) and Height (pixels).
To maintain the same aspect ratio, enter
0for the Height and vary the Width, as needed. - Click Refresh to review, then click Submit to commit customizations.
- Select the appropriate option on the Custom Chart view.
Data Volume By Node
Customizing this widget:
- From the widget, click Edit, then edit the chart Title and Subtitle as needed.
- Select appropriate values for the Default zoom range, Amount of historical data to load, and Sample interval.
- Click Submit to commit customizations.
Exporting or printing chart data:
- From the widget, click Export, then customize the chart to format it for export.
- Edit the chart Title and Subtitle as needed.
- Select appropriate values for the Default zoom range, Time Period, and Sample Interval.
- Resize the chart by selecting appropriate Width (pixels) and Height (pixels).
To maintain the same aspect ratio, enter
0for the Height and vary the Width, as needed. - Click Refresh to review, then click Submit to commit customizations.
- Select the appropriate option on the Custom Chart view.
Network Response Time (TCP Handshake) by Application
Customizing this widget:
- From the widget, click Edit, then edit the chart Title and Subtitle as needed.
- Select appropriate values for the Default Zoom Range, Amount of Historical Data to Load, and Sample Interval.
- Click Submit to commit customizations.
Exporting or printing chart data:
- From the widget, click Export, then customize the chart to format it for export.
- Edit the chart Title and Subtitle as needed.
- Select appropriate values for the Default Zoom Range, Time Period, and Sample Interval.
- Resize the chart by selecting appropriate Width (pixels) and Height (pixels).
To maintain the same aspect ratio, enter
0for the Height and vary the Width, as needed. - Click Refresh to review, then click Submit to commit customizations.
- Select the appropriate option on the Custom Chart view.
Network Response Time (TCP Handshake) by Node
Customizing this widget:
- From the widget, click Edit, then edit the chart Title and Subtitle as needed.
- Select appropriate values for the Default Zoom Range, Amount of Historical Data to Load, and Sample Interval.
- Click Submit to commit customizations.
Exporting or printing chart data:
- From the widget, click Export, then customize the chart to format it for export.
- Edit the chart Title and Subtitle as needed.
- Select appropriate values for the Default Zoom Range, Time Period, and Sample Interval.
- Resize the chart by selecting appropriate Width (pixels) and Height (pixels).
To maintain the same aspect ratio, enter
0for the Height and vary the Width, as needed. - Click Refresh to review, then click Submit to commit customizations.
- Select the appropriate option on the Custom Chart view.
QoE Applications/Nodes Exceeding Thresholds
This widget lists all monitored nodes, by application, that are exceeding specified, response time thresholds. Click [+], as necessary, to fully expand the list of monitored applications and nodes. Response times that exceed the specified Warning Level threshold are highlighted in yellow. Response times that exceed the specified Critical Level threshold are highlighted in red.
The grouping criterion is selected on the Edit Widget view for this widget, as indicated in the following procedure:
Modifying the node listing:
- From the widget, click Edit, then edit the chart Title and Subtitle, as appropriate.
Leave the Subtitle field blank for automatic grouping.
- Select appropriate options from the following drop-down lists to customize the list of monitored nodes:
- Selected Time Period
- Grouping Nodes
- Category This option is only available on the QoE Nodes Exceeding Thresholds widget.
- Risk Level This option is only available on the QoE Nodes Exceeding Thresholds widget.
- Productivity Rating This option is only available on the QoE Nodes Exceeding Thresholds widget.
- Click Submit.
Configuring Response Time Thresholds
- From the SolarWinds Platform Web Console, click Settings > All Settings > Orion thresholds.
- Under Response Time, set critical and warning levels, as required.
- Click Submit.
Quality of Experience Application Details
This widget provides QoE-related monitoring details for the viewed application. The listed details are configured when the application is initially selected for monitoring, but they may be changed.
Configuring a monitored application:
Before you begin:
- Applications are only listed if there are monitored nodes. You must first add a QoE Network or Server Sensor before you can enable any applications.
- Applications listed with the Enabled/Disabled toggle "ON" are currently being monitored on at least one node.
- Applications can be disabled (the Enabled/Disabled toggle "OFF") which means that no traffic for the application is currently collected on any node.
- Click Manage, then select the application you want to edit, and then click Edit.
- Edit the Application Name and Description, as desired.
- Using the Enabled/Disabled toggle, confirm that the application is enabled or disabled.
- Select options for the Category, Risk Level, and Productivity Rating of the application.
- Edit the URL Filter as needed.
Note: The URL filter specifies the HTTP application traffic to monitor. Changing the hostname or URL conditions changes the provided example accordingly. For example, selecting Hostname Contains changes the help text to http://*...*/path/page.html. Any text you enter will be included in the filter where the ellipses (…) appears, as indicated in the following example.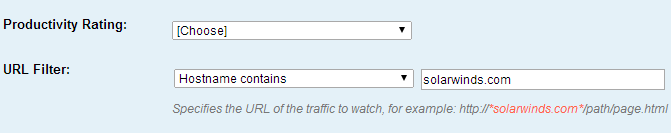
- Click Next.
- On the Configure Data Collection page, choose the node(s) you want to monitor for this type of traffic.
Only nodes already specified as nodes to monitor on the Manage QoE Nodes page will appear in this list.
- Click Next, then review your choices on the Summary page, and then click Finish.
Quality of Experience Application Statistics
This widget lists all monitored applications with QoE-related statistics that are currently collected over time. Click [+], as necessary, to fully expand the list of monitored applications and nodes.
The grouping criterion is selected on the Edit Widget view for this widget, as indicated in the following procedure:
Modifying the node listing:
- Click Edit, then edit the chart Title and Subtitle, as needed.
Leave the Subtitle field blank for automatic grouping.
- Select an appropriate Selected Time Period, then click Submit.
Configuring a monitored application:
Before you begin:
- Applications are only listed if there are monitored nodes. You must first add a QoE Network or Server Sensor before you can enable any applications.
- Applications listed with the Enabled/Disabled toggle "ON" are currently being monitored on at least one node.
- Applications can be disabled (the Enabled/Disabled toggle "OFF") which means that no traffic for the application is currently collected on any node.
- Click Manage, then select the application you want to edit, and then click Edit.
- Edit the Application Name and Description as needed.
- Using the Enabled/Disabled toggle, confirm that the application is enabled or disabled.
- Select options for the Category, Risk Level, and Productivity Rating of the application.
- Edit the URL Filter, as needed.
Note: The URL filter specifies the HTTP application traffic to monitor. Changing the hostname or URL conditions changes the provided example accordingly. For example, selecting Hostname Contains changes the help text to http://*...*/path/page.html. Any text you enter will be included in the filter where the ellipses (…) appears, as indicated in the following example.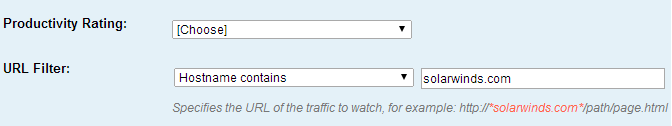
- Click Next.
- On the Configure Data Collection page, choose the node(s) you want to monitor for this type of traffic.
Only nodes already specified as nodes to monitor on the Manage QoE Nodes page appear in this list.
- Click Next, then review your choices on the Summary page, and then click Finish.
Top 10 Application Response Time
Customizing this widget for viewing in the web console:
- From the widget, click Edit, then edit the chart Title and Subtitle as needed.
- Select the Number of Items to display.
- Select appropriate options from the following drop-down lists to customize the list of monitored applications:
- Select appropriate values for the Default Zoom Range, Amount of Historical Data to Load, and Sample Interval.
- Click Submit to commit customizations.
Exporting or printing chart data:
- From the widget, click Export, then customize the chart to format it for export.
- Edit the chart Title and Subtitle as needed.
- Select appropriate values for the Default Zoom Range, Time Period, and Sample Interval.
- Resize the chart by selecting appropriate Width (pixels) and Height (pixels).
To maintain the same aspect ratio, enter
0for the Height and vary the Width, as needed. - Click Refresh to review, then click Submit to commit customizations.
- Select the appropriate option on the Custom Chart view.
Top 10 Data Volume
Customizing this widget for viewing in the web console:
- From the widget, click Edit, then edit the chart Title and Subtitle as needed.
- Select the Number of Items to display.
- Select appropriate options from the following drop-down lists to customize the list of monitored applications:
- Select appropriate values for the Default Zoom Range, Amount of Historical Data to Load, and Sample Interval.
- Click Submit to commit customizations.
Exporting or printing chart data:
- From the widget, click Export, then customize the chart to format it for export.
- Edit the chart Title and Subtitle as needed.
- Select appropriate values for the Default Zoom Range, Time Period, and Sample Interval.
- Resize the chart by selecting appropriate Width (pixels) and Height (pixels).
To maintain the same aspect ratio, enter
0for the Height and vary the Width, as needed. - Click Refresh to review, then click Submit to commit customizations.
- Select the appropriate option on the Custom Chart view.
Top 10 Network Response Time (TCP Handshake)
Customizing this widget for viewing in the web console:
- From the widget, click Edit, then edit the chart Title and Subtitle as needed.
- Select the Number of Items to display.
- Select appropriate options from the following drop-down lists to customize the list of monitored applications:
- Select appropriate values for the Default Zoom Range, Amount of Historical Data to Load, and Sample Interval.
- Click Submit to commit customizations.
Exporting or printing chart data:
- From the widget, click Export, then customize the chart to format it for export.
- Edit the chart Title and Subtitle, as needed.
- Select appropriate values for the Default Zoom Range, Time Period, and Sample Interval.
- Resize the chart by selecting appropriate Width (pixels) and Height (pixels).
To maintain the same aspect ratio, enter
0for the Height and vary the Width, as needed. - Click Refresh to review, then click Submit to commit customizations.
- Select the appropriate option on the Custom Chart view.
Top 10 Transactions
Customizing this widget for viewing in the web console:
- From the widget, click Edit, then edit the chart Title and Subtitle as needed.
- Select the Number of Items to display.
- Select appropriate options from the following drop-down lists to customize the list of monitored applications:
- Select appropriate values for the Default Zoom Range, Amount of Historical Data to Load, and Sample Interval.
- Click Submit to commit customizations.
Exporting or printing chart data:
- From the widget, click Export, then customize the chart to format it for export.
- Edit the chart Title and Subtitle as needed.
- Select appropriate values for the Default Zoom Range, Time Period, and Sample Interval.
- Resize the chart by selecting appropriate Width (pixels) and Height (pixels).
To maintain the same aspect ratio, enter
0for the Height and vary the Width, as needed. - Click Refresh to review, then click Submit to commit customizations.
- Select the appropriate option on the Custom Chart view.
Traffic By Category
Customizing this widget:
- From the widget, click Edit, then edit the chart Title and Subtitle as needed.
- In the Data to summarize field, select the type of data by which to list categories (Data Volume or Number of Transactions).
- Select an appropriate value for the selected time period.
This is the time period for which data is displayed in the widget.
- Click Submit to commit customizations.
Changing an Application Category
Before you begin:
- Applications are only listed if there are monitored nodes. You must first add a QoE Network or Server Sensor before you can enable any applications. To learn more, see Common Packet Analysis Sensor deployment scenarios.
- Applications listed with the Enabled/Disabled toggle "ON" are currently being monitored on at least one node.
- Applications can be disabled (the Enabled/Disabled toggle "OFF") which means that no traffic for the application is currently collected on any node.
- In the SolarWinds Platform Web Console, click Settings > All Settings > QoE Settings > Manage QoE Applications.
- Select the application to edit, and then click Edit.
- On the Configure Application view, edit the Productivity Rating as needed, and then click Next.
- On the Configure Data Collection view, choose the node(s) to monitor for this type of traffic.
Only nodes already specified as nodes to monitor on the Manage QoE Nodes page appear in this list.
- Click Next, then review your choices on the Summary page, then click Finish.
Traffic By Risk Level
Customizing this widget:
- From the widget, click Edit, then edit the chart Title and Subtitle as needed.
- In the Data to Summarize field, select the type of data by which to list categories (Data Volume or Number of Transactions).
- Select an appropriate value for the Selected time period.
This is the time period for which data is displayed in the widget.
- Click Submit to commit customizations.
Changing an Application Category
Before you begin:
- Applications are only listed if there are monitored nodes. You must first add a QoE Network or Server Sensor before you can enable any applications.
- Applications listed with the Enabled/Disabled toggle "ON" are currently being monitored on at least one node.
- Applications can be disabled (the Enabled/Disabled toggle "OFF") which means that no traffic for the application is currently collected on any node.
- In the SolarWinds Platform Web Console, click Settings > All Settings > QoE Settings > Manage QoE Applications.
- Select the application to edit, and then click Edit.
- On the Configure Application view, edit the Productivity Rating as necessary, and then click Next.
- On the Configure Data Collection view, choose the node(s) you want to monitor for this type of traffic.
Only nodes already specified as nodes to monitor on the Manage QoE Nodes page appear in this list.
- Click Next, review on the Summary page, then click Finish.
Transactions By Application
Customizing this widget for viewing in the web console:
- From the widget, click Edit, then edit the chart Title and Subtitle as needed.
- Select appropriate values for the Default Zoom Range, Amount of Historical Data to Load, and Sample Interval.
- Click Submit to commit customizations.
Exporting or printing chart data:
- From the widget, click Export, then customize the chart to format it for export.
- Edit the chart Title and Subtitle as needed.
- Select appropriate values for the Default Zoom Range, Time Period, and Sample Interval.
- Resize the chart by selecting appropriate Width (pixels) and Height (pixels).
To maintain the same aspect ratio, enter
0for the Height and vary the Width, as needed. - Click Refresh to review, then click Submit to commit customizations.
- Select the appropriate option on the Custom Chart view.
Transactions By Node
Customizing this widget for viewing in the web console:
- From the widget, click Edit, then edit the chart Title and Subtitle as needed.
- Select appropriate values for the Default Zoom Range, Amount of Historical Data to Load, and Sample Interval.
- Click Submit to commit customizations.
Exporting or printing chart data:
- From the widget, click Export, then customize the chart to format it for export.
- Edit the chart Title and Subtitle as needed.
- Select appropriate values for the Default Zoom Range, Time Period, and Sample Interval.
- Resize the chart by selecting appropriate Width (pixels) and Height (pixels).
To maintain the same aspect ratio, enter
0for the Height and vary the Width, as needed. - Click Refresh to review, then click Submit to commit customizations.
- Select the appropriate option on the Custom Chart view.