API poller use case: Monitor a Nutanix cluster
This use case shows how to use the API poller feature with another SAM feature, Monitor hardware health for Nutanix clusters. We'll create an API poller to monitor a Nutanix cluster via the Nutanix REST API. This use case includes a GET request to retrieve data about a cluster but you could also use a POST request to update the cluster's configuration.
To learn about the API, see Nutanix API Reference.
To create an API poller that monitors hardware health for a Nutanix cluster:
- Navigate to the Node Details view for the Nutanix node that hosts the cluster.
-
In the Management widget, hover over the API Poller link and click Create.

- Select the GET Method.
- Provide a Request URL for the API: https://www.nutanix.dev/api_references/prism-v2-0/ that includes the following elements:
- The https protocol encrypts data sent back and forth.
- any_cvm_ip is a variable.
- 9440 is the default Nutanix Prism communication port.
- /api/nutanix/v2.0/clusters is the endpoint for the request.
- Click Configure.
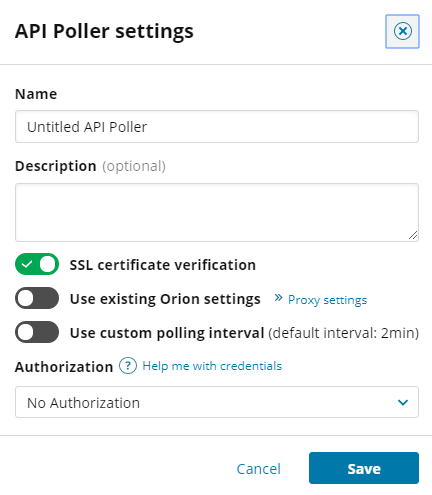
- In the API Poller settings dialog box:
- Provide a Name:
Nutanix Prism - Provide a Description:
https://any_cvm_ip:9440/api/nutanix/v2.0/clusters (Optional) Disable SSL certificate verification.
By default, SAM checks for a valid certificate in each API request. For this use case, we'll disable that option.
- (Optional) Enable existing SolarWinds Platform settings for proxy servers.
- (Optional) Adjust the default polling interval, 2 minutes.
- For Authorization, select Basic authorization.
- Select an existing set of credentials from the Credentials Library, or enter them manually.
Click Save.

- Provide a Name:
- Click Send Request.
- When results appears In the Response treeview at the bottom of the page, expand the data to display available metrics.
- For this example, we'll monitor the number of nodes and receive alerts if the quantity drops below 3, which can affect our data resiliency status.
- Click the Monitor (
 ) icon for the num_nodes metric.
 - In the "Configure a value to monitor" dialog box, provide a name for the metric and set the warning threshold as less than 3.
- Click the Monitor (
- Click Save
- Click the menu icon
 , and then click Duplicate.
 - Edit the URL for the second request to retrieve the read IOPs metric:
https://any_cvm_ip:9440/PrismGateway/services/rest/v2.0/cluster/stats?metrics=num_read_iops - Click Send request to check the response.
- When results appears In the Response treeview at the bottom of the page, expand the data to display available metrics.
- Set up a warning threshold to detect when the number of read operations surpasses 200 milliseconds.
- Click the Monitor (
 ) icon for the num_read_iops.
 - In the "Configure a value to monitor" dialog box, provide a name for the metric and set the warning threshold to 200.
- Click the Monitor (
- Click Save.
When you return to the Node Details view, the API Poller widget shows the new pollers: one for the number of nodes in the Nutanix cluster and one for read IOPs. Wait 2 minutes for polling to occur. After monitored metrics appear, you can see the latest metrics received in the API Poller widget, click the Performance Analyzer link in the Management widget to display data in PerfStack, or display metrics in SolarWinds Platform Maps that include the node.
