Microsoft Azure Virtual Machine Scale Set API poller template
Use this SAM API poller template to monitor Microsoft Azure VM performance and statistics counters, including CPU, traffic, and disk metrics.
Prerequisites
-
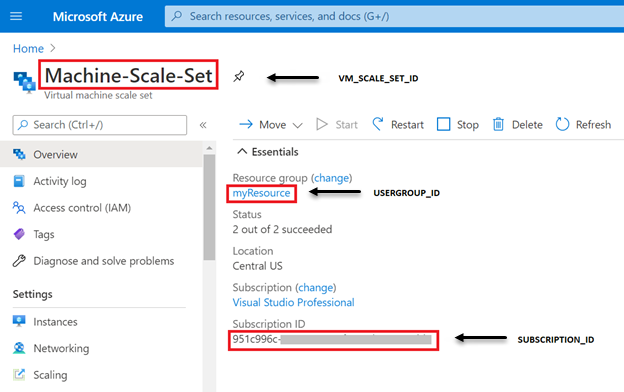
Use the following parameters to specify the API endpoint in the request URL:
- ${SUBSCRIPTION_ID}
- ${USERGROUP_ID}
- ${VM_SCALE_SET_ID}
Use the following example to help locate values in Azure:

-
Configure OAuth 2.0 Azure credentials with the following values:
- Scope:
https://management.azure.com/.default - Access Token URL:
https://login.microsoftonline.com/{TENANTID}/oauth2/v2.0/token
Although "(optional)" appears next to the Scope field in the UI, this value is required for API pollers based on this template.
- Scope:
-
The Virtual Machine Scale Set has access control to the Application with at least the Reader role.

Notes
- Default thresholds are not set for this template.
- (Optional) Add the following metrics to API requests created with this template:
- Network In
- Network Out
- Per Disk Read Bytes/sec
- Per Disk Write Bytes/sec
- Per Disk Read Operations/Sec
- Per Disk Write Operations/Sec
- Per Disk QD
- OS Per Disk Read Bytes/sec
- OS Per Disk Write Bytes/sec
- OS Per Disk Read Operations/Sec
- OS Per Disk Write Operations/Sec
- OS Per Disk QD
- Data Disk Read Bytes/sec
- Data Disk Write Bytes/sec
- Data Disk Read Operations/Sec
- Data Disk Write Operations/Sec
- Data Disk Queue Depth
- OS Disk Read Bytes/sec
- OS Disk Write Bytes/sec
- OS Disk Read Operations/Sec
- OS Disk Write Operations/Sec
- OS Disk Queue Depth
- Inbound Flows
- Outbound Flows
- Inbound Flows Maximum Creation Rate
- Outbound Flows Maximum Creation Rate
- Premium Data Disk Cache Read Hit
- Premium Data Disk Cache Read Miss
- Premium OS Disk Cache Read Hit
- Premium OS Disk Cache Read Miss
- Here is a request example:
https://management.azure.com/subscriptions/6a4208fe-5200-417e-9365-99781c6133c3/resourceGroups/Monitoring/providers/Microsoft.Compute/virtualMachineScaleSets/JRVMSCALESET/providers/microsoft.insights/metrics?interval=PT1H&metricnames=Percentage CPU,Network In Total,Network Out Total,Disk Read Bytes,Disk Write Bytes,Disk Read Operations/Sec,Disk Write Operations/Sec,CPU Credits Remaining,CPU Credits Consumed&aggregation=Average,Total&api-version=2019-07-01 -
If Monitor entities by tags is chosen as the Resources Monitoring Method for your Azure cloud account but no tags are specified, then all entities will be monitored.
Available metrics
CPU Percentage
The average percentage of allocated compute units that are currently in use by the given VM via PowerShell cmd-let.
Unit: Percent
Network Incoming Traffic
The total number of bytes received on all network interfaces for the given VM (Incoming Traffic) via PowerShell cmd-let.
Unit: Bytes
Network Outgoing Traffic
The total number of bytes out on all network interfaces by the given VM (Outgoing Traffic).
Unit: Bytes
Disk Read Bytes/Sec
The total bytes read from disk during monitoring period for the given VM via PowerShell cmd-let.
Unit: Bytes
Disk Write Bytes/Sec
The total bytes written to disk during monitoring period for the given VM via PowerShell cmd-let.
Unit: Bytes
Disk Read Operations/Sec
The average number of Disk Read Operations per second for the given VM via PowerShell cmd-let.
Unit: CountPerSecond
Disk Write Operations/Sec
The average number of Disk Write Operations per second for the given VM via PowerShell cmd-let.
Unit: CountPerSecond
CPU Credits Consumed
The total number of credits consumed by the given VM.
Unit: Count
