Define the object to report on
We want to report on top 5 traffic sources, destinations, protocols and ports used by a specified endpoint. We are therefore interested in the endpoint's conversations, and need to specify the endpoint and protocols we are interested in.
- Select the Dynamic Query Builder selection method.
- Details shown on the report will change over time, so we need to select the objects for the report dynamically. For more details about the other selection methods, see "Adding a Custom Table to a Web-Based Report Column".
- Select Advanced Selector.
- Advanced selector provides a list of associated objects and allows you to define objects for the report by their properties in a defined relation. You can also create blocks of conditions. We need to define that we want to see all NetFlow Flow By Conversation History objects, specify the appropriate source and destination IP addresses, and protocols we are interested in. We thus need to use the Advanced selector. For more details, see the SolarWinds technical reference SolarWinds Platform Web-Based Reports.
- Basic Selector allows you to create simple conditions. The Select field list provides properties of the selected object, and allows you to select a property, the appropriate relation and a value the resulting objects should or should not have, according to the selected relation.
- Select NetFlow Flow By Conversation History as the object to report on.

-
Define the appropriate source IP address:
- Click Select field. The Add Column dialog opens.
- Make sure Netflow Flow By Conversation History is selected in the SolarWinds Platform Object list.
- Below this item, select Netflow Flow By Conversation History.
- In the Database column name list, select Source IP, and click ADD COLUMN.
- Back in the Add Content screen, go to the Source IP property list, select is equal to, and enter the appropriate source IP address.
- Define possible destination IP addresses.
We want to specify two possible destination IP addresses and that we want to report on conversations whose destination IP is one of those IP addresses.
- Click the
 icon and select Add And/Or Block.
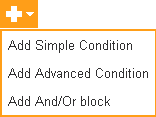
- Click Select field.
- Now in the Add Column screen, make sure you have selected Netflow Flow By Conversation History in both the drop-down list and below it.
- Select Destination IP and click ADD COLUMN.
- Back in the Add Content screen, go to the Destination IP property list, select is equal to and provide an appropriate IP address.
- Click the icon and select Add Simple Condition.
- Repeat steps b-e to add the other Destination IP address.
- Go to the parent drop-down list and select At least one child condition must be specified (OR).
- Click the
- Define protocols you want to follow.
We are interested in application traffic, and we will thus specify that we want to report on traffic connected with UDP and TCP protocols. These protocols are used by applications.
- Click the icon connected with the protocol specification and select Add And/Or Block.
- Click Select field.
- Now in the Add Column screen, make sure you have selected Netflow Flow By Conversation History the drop-down list.
- Select Netflow Protocol below the drop-down list.
- Select Protocol Name and click ADD COLUMN.
- Back in the Add Content screen, go to the Protocol Name property list, select is equal to and enter UDT.
- Click the icon and select Add Simple Condition.
- Repeat steps b-e to add the TCP Protocol.
- Go to the parent drop-down list and select At least one child condition must be specified (OR).
- Click the
- Provide a name for the selection in the Selection Name field. Selection names are useful when editing reports that consist of more tables or charts.
- Click ADD TO LAYOUT.
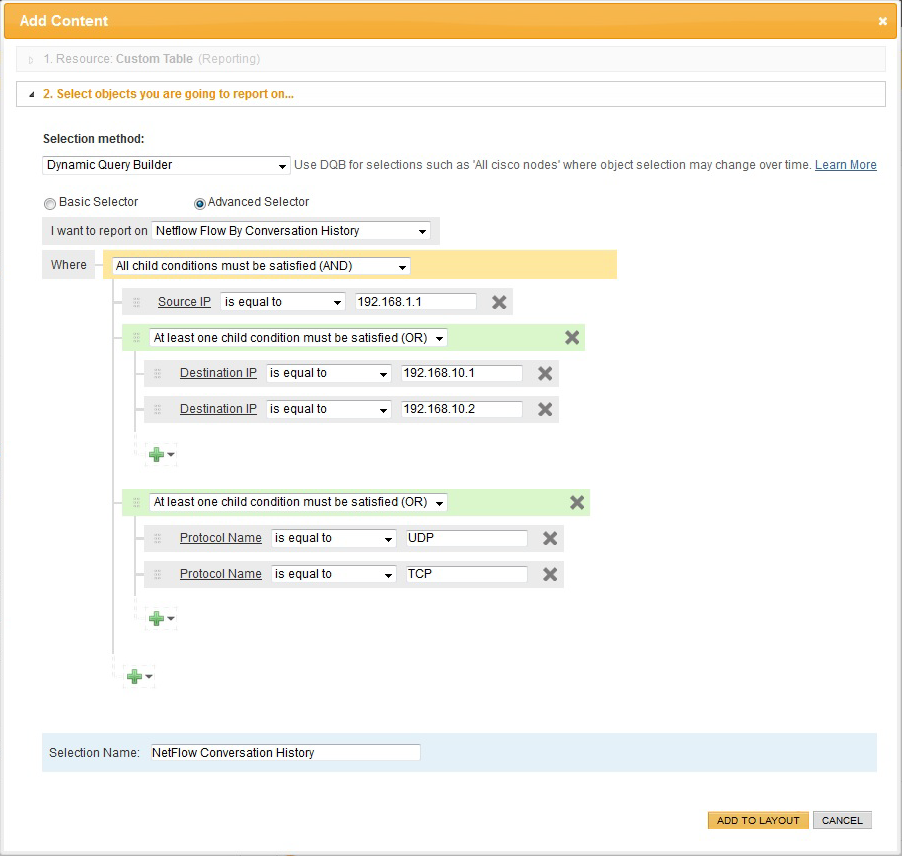
The definition should look like this: