Event Log monitor
The Event Log monitor locates information within Error, Warning, Information, Success Audit and Failure Audit events recorded in the Microsoft Windows event logs.
The monitor uses header information to locate specific events. However, the description is often the most useful piece of information because it indicates problem occurrence or the significance of the event.
As the format and contents of the event description vary depending on the event type, the Event Log monitor requires a regular expression (regex) to filter specific details from the description field. This can be a simple regular expression that captures the entire contents of the description field, or a more sophisticated regular regex to filter only specific parameters.
The events table only displays ipMonitor events relating to the monitor status. It does not display the events captured by the Windows Event Log monitor.
Log types
The Event Log monitor can monitor working and non-working logs. Both log types require separate configurations.
Working logs
Working logs are not located in a nested directory. When you open the Event Viewer to locate the targeted log file, the file is stored at the root level.
For example, you want to create an Event Log monitor for the Application file located in the Windows Logs directory. This file is located at the root level, as shown below.

The following working logs can be monitored for any server or workstation version of Microsoft Windows:
- Application
- Security
- System
The following working logs can be monitored for computers running as a domain controller:
- Directory Service
- File Replication Service
The DNS Server log can be monitored for computers running as a Domain Name System (DNS) server.
To create a monitor for a working log, see Create an Event Log monitor.
Non-working logs
Non-working logs are located in a nested directory. When you open the Event Viewer to locate the targeted log file, you must drill down through one or more directories to access the file.
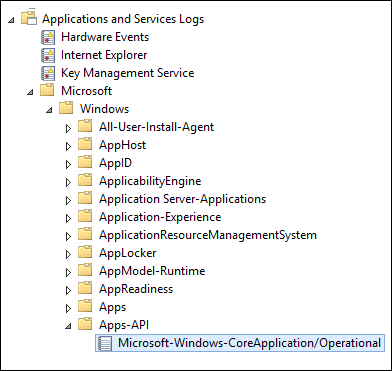
For example, you want to create an Event Monitor log for the Microsoft-Windows-CoreApplication/Operational file in the Microsoft > Windows > Apps-API directory. This file is in a nested directory, as shown below.

To create a monitor for a non-working log, create a Registry key that provides a shortcut to the file. When you are finished, create an Event Log monitor and configure the Identification and Test Parameters section as follows:
- In the Filters > Event Area drop-down menu, select User Defined.
- In the Event Area field, enter the path to the log.
- In the Event Type field, select the correct event type for the log file.
- Configure the remaining settings as required.
The following window provides an example of how to configure the Identification and Test Parameters sections when you create an Event Log monitor for the Operational log file located at Applications and Services Logs > Microsoft > Windows > Apps-API.

Create a Registry key
Warning: SolarWinds strongly recommends that you back up your registry before making any edits to your system registry. You should only edit the registry if you are experienced and confident in doing so. Using a registry editor incorrectly can cause serious issues with your operating system, which could require you to reinstall your operating system to correct them. SolarWinds cannot guarantee resolutions to any damage resulting from making registry edits.
This procedure describes how to create a Registry key that provides a shortcut to a non-working log.
- Back up your system registry.
- Log in to the target machine.
- Open the Event Viewer.
-
Locate the non-working event log you want to monitor.
For example:
Microsoft-Windows-CoreApplication/Operational
- Right-click the file and select Properties.
-
In the General tab, copy the content from the Full Name and Log path fields to a text document.
The file should be located at:
C:\\Windows\System32\winevt\logs\Microsoft-Windows-CoreApplication%4Operational
- Close the Log Properties window.
-
Open a Run box and execute:
regedit.exe -
In the Registry Editor, locate the EventLog directory at the following path:
HKEY_LOCAL_MACHINE > SYSTEM > CurrentControlSet > Services > EventLog - Right-click EventLog and select New > Key.
-
Enter a name for the log file using the following syntax:
<path_to_folder>/<log_file_name>For example:
Microsoft-Windows-CoreApplication/OperationalWhen you are finished, the new key displays in the EventLog directory.

- Modify the key to include the full name and log path you copied to a text document in step 6, and the path to the Windows Event Log API DLL file (
wevtapi.dll).- Locate and open the text document you saved from step 6.
- Right-click the new key and select New > String Value.
- Name the string value
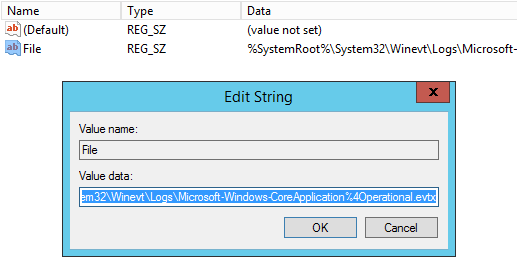
File. - Right-click the new string value and select Modify.
Copy the log path from the text file to the Value Data field, and then click OK.
This file should be located in your Windows Server operating system at:
C:\\Windows\System32\winevt\logs\Microsoft-Windows-CoreApplication%4Operational
- Right-click the new key and select New > String Value.
- Name the string value
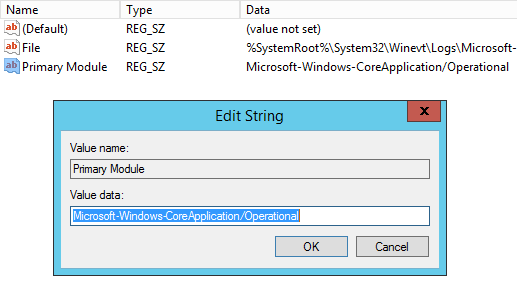
Primary Module. - Right-click the new string value and select Modify.
Copy the full name from the text file to the Value Data field, and then click OK.
For example:
Microsoft-Windows-CoreApplication/Operational
- Right-click the new key and select New > String Value.
- Name the string value
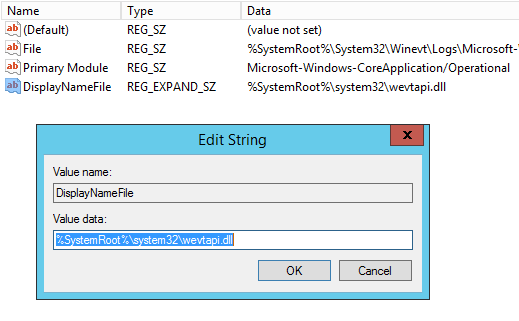
DisplayNameFile. - Right-click the new string value and select Modify.
Copy the path to the Windows Event Log API DLL file (
wevtapi.dll) in the Value data field, and then click OK.This file should be located in your Windows Server operating system at:
C:\\Windows\System32\wevtapi.dll
- Close the Registry Editor.
-
Open the Event Viewer.
The new key displays at the root level of the Applications and Services Logs directory.

Create an Event Log monitor
When you create a new Event Log monitor, the monitor starts searching forward from the time of creation. It does not search historical content currently in the Event log file.
When you configure your monitors, you can suspend and then unsuspend a monitor to force an immediate test. This procedure does not work with the Event Log monitor because its pointer resets to its current time—or essentially the end of the log file. A real event needs to occur for the monitor to send an Information alert. However, the Preview test searches the content in the Event log, which is ideal for configuration and troubleshooting purposes.
SolarWinds recommends using the default 300-second timing intervals between scans. The Event Log monitor queries the Event Log through the WMI service, which may consume a considerable amount of resources on the target machine. The 300-second interval is a good balance between the length of time it takes to query the Event Log and the load placed on the target machine's CPU.
Setting the timing interval below 180 seconds can generate security and authentication issues, especially in situations where multiple event log monitors target a single machine using a credential that impersonates a domain account.
- Click Devices in the toolbar.
- Locate and click the targeted device you want to monitor.
- In the toolbar, click Add > Add New Monitor.
- In the Select Monitor page, click Event Log.
-
Complete the Identification section.

- Enter the IP address of the host or targeted server.
- Select the Enabled checkbox to enable the monitor.
- (Optional) Select the remaining checkbox if you want to begin to record the test results. The result will be used to generate the Recent Activity and Historical reports.
-
Complete the Test Parameters section.
If you are completing this section to monitor a non-working log, see Non-working logs for additional information.

- Enter the IP address or host name of the target server you want to monitor. Click Browse to select the server from the server list.
-
(Optional) Select a credential with Administrator-level permissions to access and read the security logs. When selected, ipMonitor uses the credential account and password information to authenticate to the target machine. If you do not assign a credential, ipMonitor uses the current ipMonitor Service account privileges on the local machine.
-
Click the Event Area drop-down menu and select an event log type.
Select... If you want to... System Monitor events logged by Microsoft Windows system components. Application Monitor events logged by applications or programs. Security Record events (such as valid and invalid logon attempts) and resource use events (such as creating, opening, or deleting files or other objects). File Replication Service Monitor events logged by the Windows File Replication service. Directory Service Monitor events logged by the Windows Directory Service. DNS Server Monitor events logged by the Window DNS service. User Defined Monitor events for a non-working log. After you select this option, enter the path to the file in the Event Area field. -
Click the Event Type drop-down menu and select the type of event you want to monitor.
Select... To indicate... Error An error occurred. For example, a service failed. Security Audit Success A successful security access attempt. Security Audit Failure A failed security access attempt. Warning An application, driver, or service issue. Information An application, driver, or service was successful. -
Click Enable to enable any remaining filter and enter a value where:
- Event ID is the specific event type.
- Event Source is the name of the application that logged the event.
- Logged by User is the user name of the account that generated the event (if available).
-
Under Content Matching Event Text with Regular Expressions, enter a regular expression to locate specific information within the event description.
For example, to send the entire content of an event, enter (.*). This would be ideal for an email alert sent to your cell phone. Click Regex Wizard for assistance with creating a regular expression.
- Click the Content Generator drop-down menu and select a format for the alerts.
- Click Preview to test your configuration. ipMonitor connects to the targeted event log file and searches the file entries that currently exist based on the test parameters.
-
Complete the Timing section.
ipMonitor uses these parameters to increase or decrease testing during the Up, Warn, Down, and Lost states. For example, you might increase testing when a monitor ends a Warn state and decrease testing when a monitor enters a Lost state.

- In the Maximum Test Duration field, enter a value (in seconds) that indicates when to timeout a test. For example, if no response is returned in 300 seconds, the test failed.
- In the Delays Between Tests While Up field, enter a value (in seconds) that indicates the amount of time between each test while the monitor is in an OK state.
- In the Warn field, enter a value (in seconds) that indicates the number of seconds between each test while the monitor is in a Fail state. No alerts are processed in this state.
- In the Lost field, enter a value (in seconds) that indicates the number of seconds between each test while the monitor is in a Fail state and the maximum number of alerts are processed. No additional alerts are processed, but a Recovery Notification is sent if the monitor recovers.
-
Complete the Notification Control section.
ipMonitor uses these parameters to determine many test failures must occur before an alert is sent, and the maximum number of alerts that will be sent.

-
Enter the number of test failures that must occur before an alert is generated for the monitor.
Each time a monitor test fails during a Warn state, a sequential failure count is incremented and checked against this value. A successful test at any point resets the accumulated failure count to zero.
- Enter the maximum number of alerts to generate before the monitor enters a Lost state. A successful test by the monitor while in the Down or Lost state cases the alert sequence to reset.
- Click the Combine Information Alerts drop-down menu and select an option. You can combine multiple failures detected in a single test into one alert. Up to five matches found will be processed individually.
-
-
Complete the Recovery Parameters section.
ipMonitor uses these parameters to automatically restore a failed resource using the External Process, Reboot Server, or Restart Service recovery actions.

- Enter the IP address or name (NetBIOS or FQDN) of the machine hosting the service that needs to be restarted or the machine that needs to be rebooted.
-
Select the credential used by a recovery alert to access restricted resources, such as Reboot Server, Restart Service, and External Process.
If a credential is not assigned, ipMonitor uses the Microsoft Windows account assigned to the ipMonitor Service. The results will depend on the level of access the service has to access resources on the network.
-
Select the list of services to restart on the machine specified in the FQDN/NetBIOS/IP Address field.
This is only required for the Restart Service alert. If a service has dependencies, select all dependent services.
- Click OK.
Create a monitor text log
If you need a history of events captured by the Windows Event Log Monitor, create a Text Log action to record the information messages generated by the monitor.
- In the toolbar, click Configuration.
- Under Configuration, click Alert List.
- In the toolbar, click Add Alert.
- In the Alert Name field, enter a unique name that best describes this alert.
- Select Alert Enabled to enable this alert.
- Select an Action Control option that indicates whether all monitors and groups assigned to this alert will be able or unable to trigger actions.
- Under Actions, click Add Action and select Text Log.
- In the Action Name field, enter:
Text Log Action -
Under Availability, click the individual days and choose when the alert is active or disabled during a 24-hour period.
You can also accept the default selections to enable this alert to be active 24 hours a day, seven days a week.
-
In the Alert Range field, enter the number of notifications ipMonitor must receive before it generates an alert.
For example, use the default value 1- to indicate that an alert will be sent on the first and subsequent notifications.
Enter 1-3 to indicate that an alert will be sent on the first, second, and third notifications.
You can also enter combinations of values such as 1-3,6-9 to indicate that an alert will be sent only on the first through third and the sixth through ninth notifications.
- Under Action Parameters, do the following:
- In the File Name field, enter a name for the log file. For example:
eventlog.txt. In the Directory field, enter a path to the log file source, leaving out the file name. This can be a local or UNC path. For example:
c:\logfilesThe credential or ipMonitor account must have permission to create and modify this file on a remote network machine.
In the Credentials for Action field, click Select to create or choose a credential to use when performing this alert.
Using a credential allows you to use a different account, instead of the default account executing the ipMonitor Service.
- In the File Name field, enter a name for the log file. For example:
- Under Notification Content - Failure Messages, deselect the checkbox since this message is not a failure message.
- Under Notification Content - Recovery Messages, deselect the checkbox since this message is not a recovery message.
- Under Notification Content - Information Messages, select the checkbox.
- In the Information Message Text field, enter any additional text to include in the message. The existing variables will include the date, time, and generated content from the error in the message.
- Click OK.
Tests on Event Log monitors differ from other monitors
When you create a new Event Log monitor, the monitor starts searching forward from the time of creation. It does not search historical content currently in the Event log file.
When you configure your monitors, you can suspend and then enable a monitor to force an immediate test. This procedure does not work with the Event Log monitor because its pointer resets to its current time—or essentially the end of the log file. A real event needs to occur for the monitor to send an Information alert.
However, the Preview test searches the content in the Event log, which is ideal for configuration and troubleshooting purposes.
Recommended default timing interval
SolarWinds recommends using the default 300 second timing intervals between scans. The Event Log monitor queries the Event Log via the WMI service, and this service may consume a considerable amount of resources on the target machine. The 300-second interval is a good balance between the length of time it takes to query the Event Log and the load placed on the target machine's CPU.
Setting the timing interval below 180 seconds can generate security and authentication issues, especially in situations where multiple event log monitors target a single machine using a credential that impersonates a domain account.
