Create an alert in ipMonitor
Alerts notify you when a monitor identifies a problem in a device—for example, when a predefined threshold is passed or a connection failure occurs. You can configure alerts to notify you immediately when a monitor detects an issue in a mission-critical device.
You can use the Alert Wizard in the Alert List screen to walk you through the process of creating a simple email alert. To select a different notification method or create an alert with additional options, click Add Alert and complete the screens.
See Alerts and Notifications for more information about alerts. See SNMP Trap - User Experience monitor to create SNMP trap alerts.
Create an alert using the Alert Wizard
The Alert Wizard walks you through the process of creating a simple email alert that notifies you when a monitor triggers an issue.
- Log in to IpMonitor.
- Click Configuration in the toolbar.
-
In the Configuration screen, click Alert List.

-
Click Alert Wizard.

-
Choose whether to create a simple email alert or use an existing alert.

To use an existing alert, click the drop-down menu, select an alert, and then click Next. Go to step 7.
To create a simple email alert, select this option and then click Next.
- In the Create a New E-Mail Alert screen, configure the alert that triggers an email action when your devices fail.
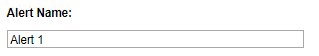
Enter a name for this alert and enable the alert.
For example, Alert 1.
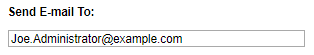
Enter an email address of a user who is assigned to address this alert notification.
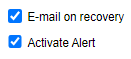
Select the checkboxes to email you when the monitor or device recovers and whether to activate this alert.
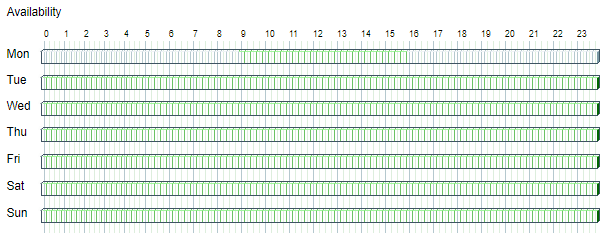
- In the Availability graph, click Monday.
Select a time range in Military Time when an alert email can be sent to you. Click the time slots that do not apply to your time range.
For example, 08:00 to 15:00 (8AM to 3PM).
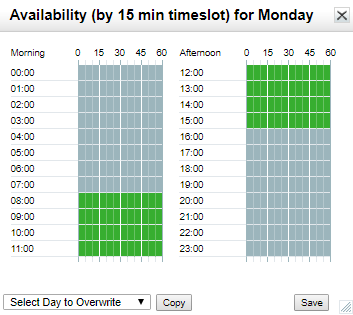
Click Save.
The graph reflects the selected time range for Monday.
- Click the drop-down menu.
- Select another day when you are available to receive email notifications, and then click Copy.
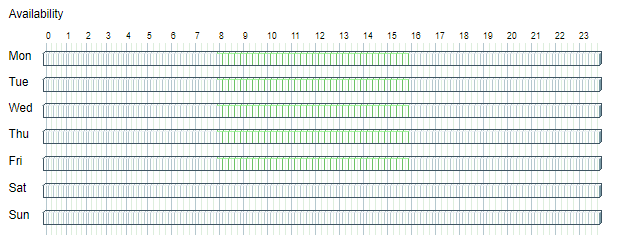
- Perform steps g and h for the remaining days you are available. Adjust the time ranges accordingly.
Click Save to save your availability day range.
For example, the following graph indicates that you are available between 8AM and 6PM Monday through Friday to receive email notifications for this alert.
- When you are finished, click Next.
-
Select a monitor, group, or device that triggers the alert, and then click Next. For example, when you select a device, the device IP address and Device type display in the selection.

-
In the Wizard Summary, verify that the selections are correct, and then click Create Alert.
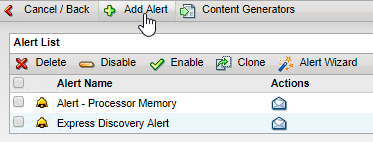
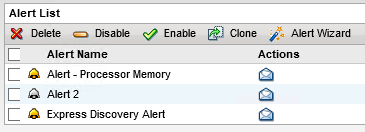
The alert displays in the Alert List. The Yellow icons indicate an alert you created in the Alert Wizard.

Create an alert with additional options
The Add Wizard selection allows you to configure an alert to perform several actions, such as sending a simple email, reboot a server, and restart a service. You can also add a monitor, group, or device to the alert. If a failure occurs, all monitors configured to the alert will use the notifications you configure in the alert.
- Log in to the ipMonitor Administrator web interface.
- Click Configuration in the toolbar.
-
In the Configuration screen, click Alert List.
- Click Add Alert.
-
Enter a name for this alert and enable the alert.
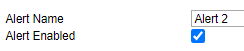
- Select the Alert Enabled checkbox to enable this alert.
-
Select an action to perform when the monitor generates the alert.

To enable all monitors and groups assigned to this alert to trigger an action, select Alert for Groups and Monitors that are listed.
To disable all monitors and groups assigned to this alert to trigger an action, select Alert for Groups and Monitors that are not listed.
- Select an action that runs when the alert is triggered.
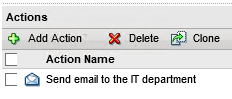
- Click Add Action and select an action.

For example, select Simple Email to send an email to your IT department when the targeted monitor triggers an alert.
See Action Types and Information Alerts for descriptions of all action types.
Complete the required fields for your selected action type, and click OK.
The alert displays under Actions.
- Repeat step a and step b to add additional actions.
- Click Add Action and select an action.
-
Add a monitor, group, or device to the alert.

- Click OK.
The Alert is enabled and added to the Alert List page.
The Yellow icons indicate an alert you created in the Alert Wizard. The Silver icon indicates an alert you created by clicking Add Alert.
Disable an alert
- Log in to ipMonitor as an administrator.
- Click Configuration > Alert List.
- Locate and select the alert you want to disable.
- Click Disable.
Troubleshoot a failed monitor alert
When a failed monitor does not trigger an alert, do the following:
- Log in to ipMonitor.
- Open the Settings page for the failed monitor that did not trigger an alert.
-
In the toolbar, click Downtime Simulator.

-
Set the Downtime Start Time value to the weekday and the time when the failure occurred, and then click Update.

-
In the first red box, note the actions listed (if any) and their values in the Queued column.
For example:

If the value is No:
- Click the action name. This will take you to the action's Settings page.
- View the Availability calendar to verify that the time of failure is not excluded.
- View the Alert Range value to verify that it is not set to a value higher than 1 or 1-.
If the value is Yes:
- Close the Downtime Simulator window.
- Note the "id=" value at the end of the address in the browser address bar.
-
Search for the ID in the following file to determine when the monitor went into a Down state (the only state where alerts are triggered) and what alerts were triggered:
-\program files (x86)\solarwinds\ipmonitor\ipm{Date}.logwhere
{Date}is the date the failure occurred.