Grafana
Grafana is a Data Visualization platform that allows you to query, visualize and alert on metrics no matter where they are stored.
Route detailed alerts from Grafana to the right users in Incident Response.
How to integrate Grafana with Incident Response
In Incident Response: Using Grafana as an Alert Source
-
Navigate to Services -> Service Overview -> select or search for your Service. Expand the accordion -> In the Alert Sources section, click Add.
-
Select Grafana. Copy the displayed Webhook URL to configure it within Grafana. Finish by clicking Add Alert Source -> Done.


When an alert source turns Active, it’ll show up under Configured Alert Sources. You can either generate a test alert from the integration or wait for a real-time alert to be generated by the Alert Source.
An Alert Source is active if there is a recorded incident via that Alert Source for the Service.
In Grafana: Create a Incident Response Webhook as a Notification Channel
-
Login to your Grafana dashboard, click on the Alerting (Bell) icon and select Notification Channels
-
Click on Add Channel or New Channel and enter the Notification Channel
Nameas Incident Response and underType, select webhook -
Under
url, enter the Webhook URL we have got from the Incident Response Service you copied before -
Expand
Optional Webhook Settingsand select POST underHttp method. -
Under
Notification Settings, check Default to send all alert data to Incident Response. You can uncheck this if you want only specific Grafana Panels to send alerts to Incident Response. Move over to this section of our documentation to set up alerting for Specific Grafana Panels.


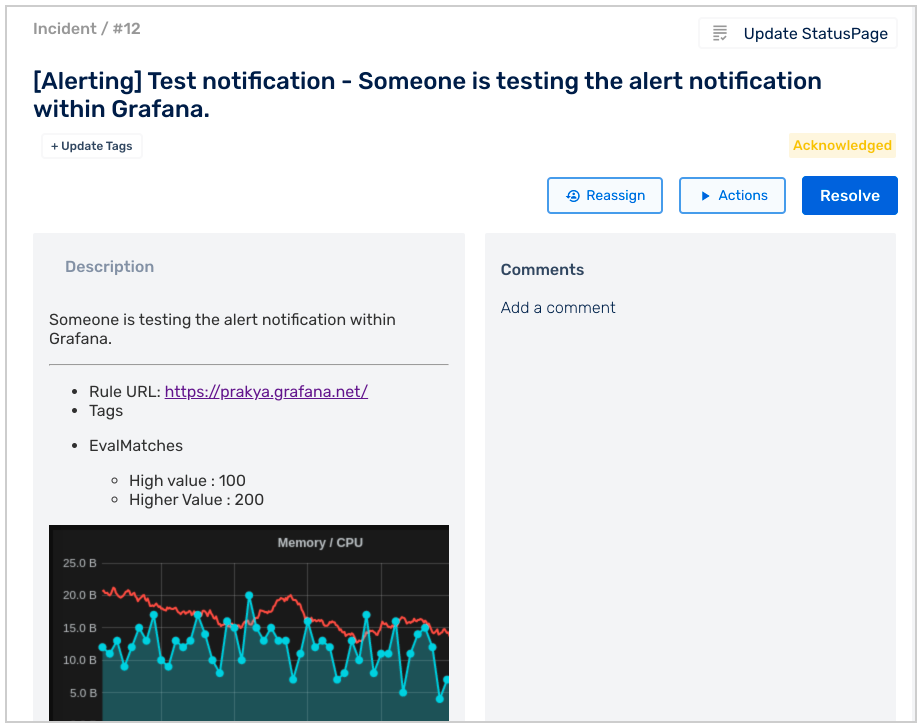
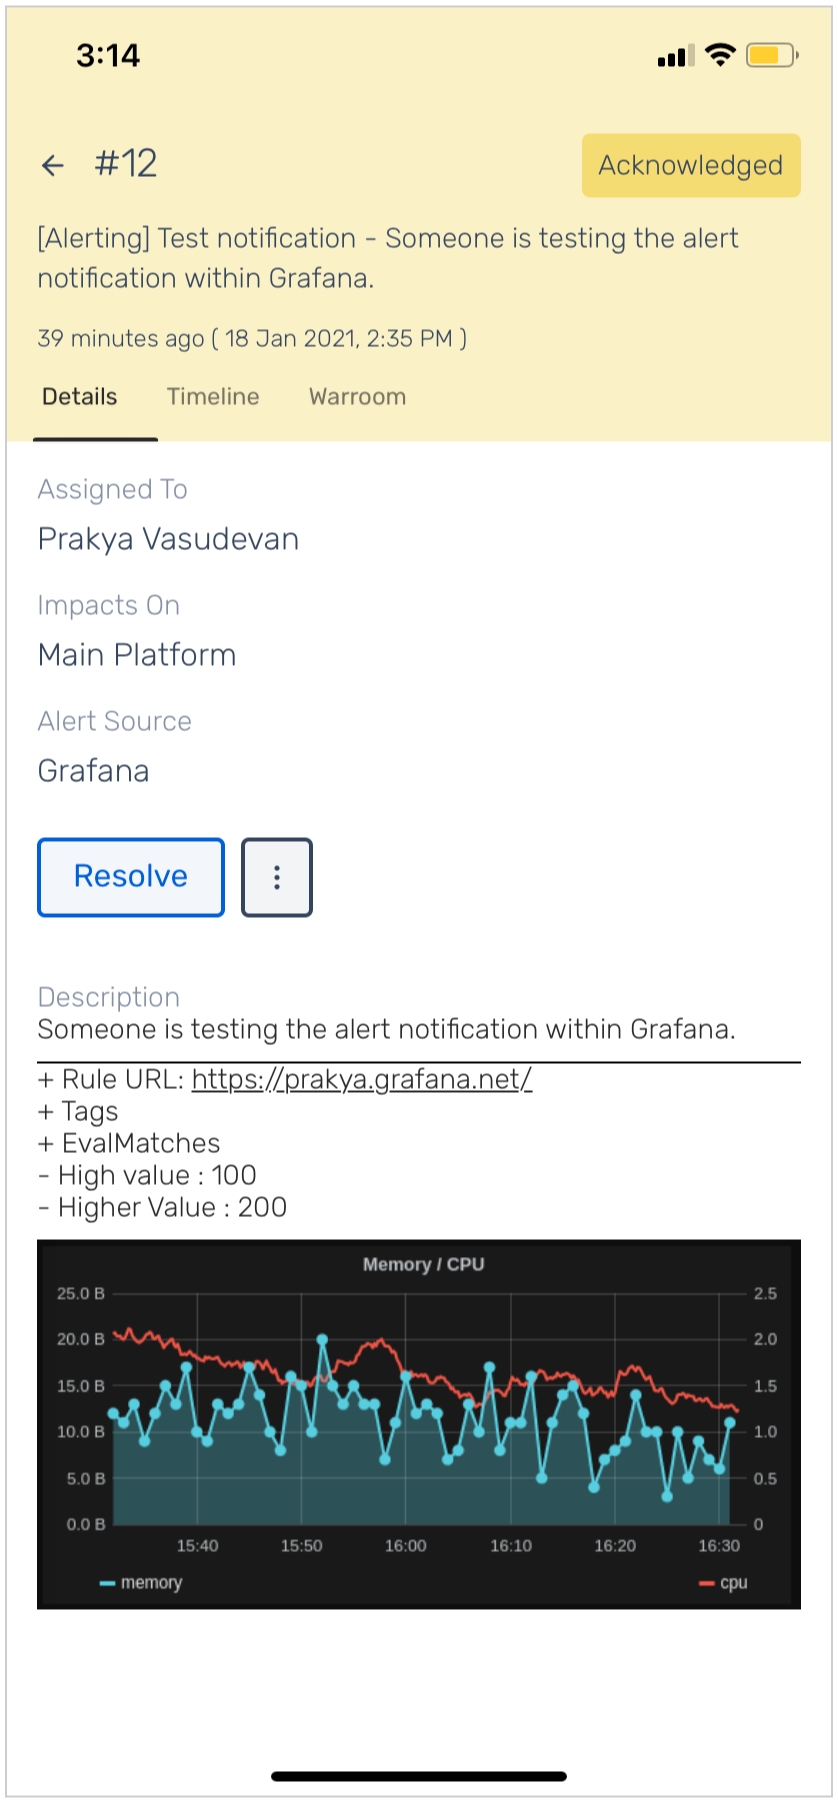
Sending Grafana Images into Incident Response
-
If you'd like to include images to your incident, check Include Image and you should see it as a part of your incident description in Incident Response.
-
The Image URL must be public or accessible from your computer for it to be visible on Incident Response.
-
Even if the Image is not accessible, the Image URL will be provided in the Incident Description.
Helpful Grafana Links
Important: Auto Resolve
If you would like to enable Auto-Resolve in Incident Response, then make sure the Disable Resolve Message is unchecked.

-
Click on Save to enable the integration. You can test the integration by clicking on Test. This will trigger a test incident in Incident Response.

Setup Alerting for Specific Grafana Panels
Pre-requisite
Incident Response should be added as a Notification Channel in your Grafana account. Follow steps 1-5 here and ensure the following:
Default is unchecked to allow only specific alerts of your choosing
Include image is checked if you want to add images to your Incident Response incidents
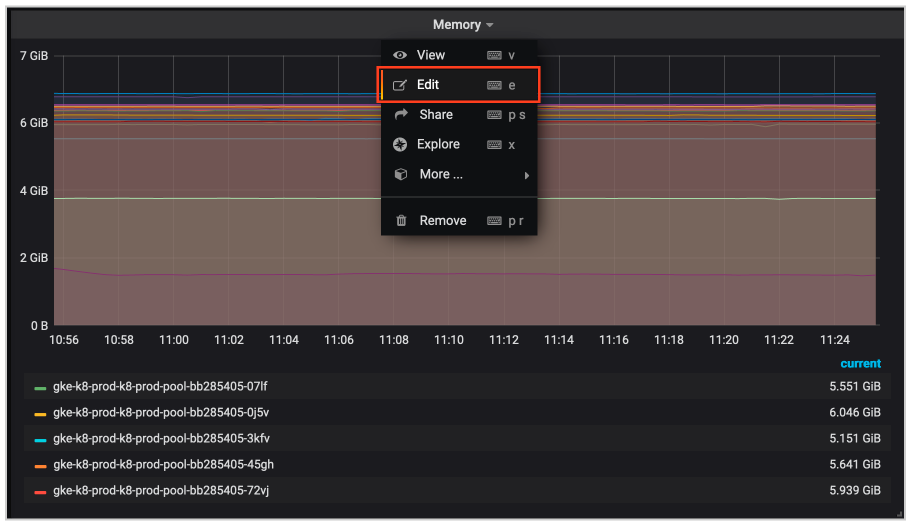
After you've saved Incident Response Webhook as a Notification Channel for your Grafana account, navigate to the panel from your Grafana Dashboard and under options select Edit
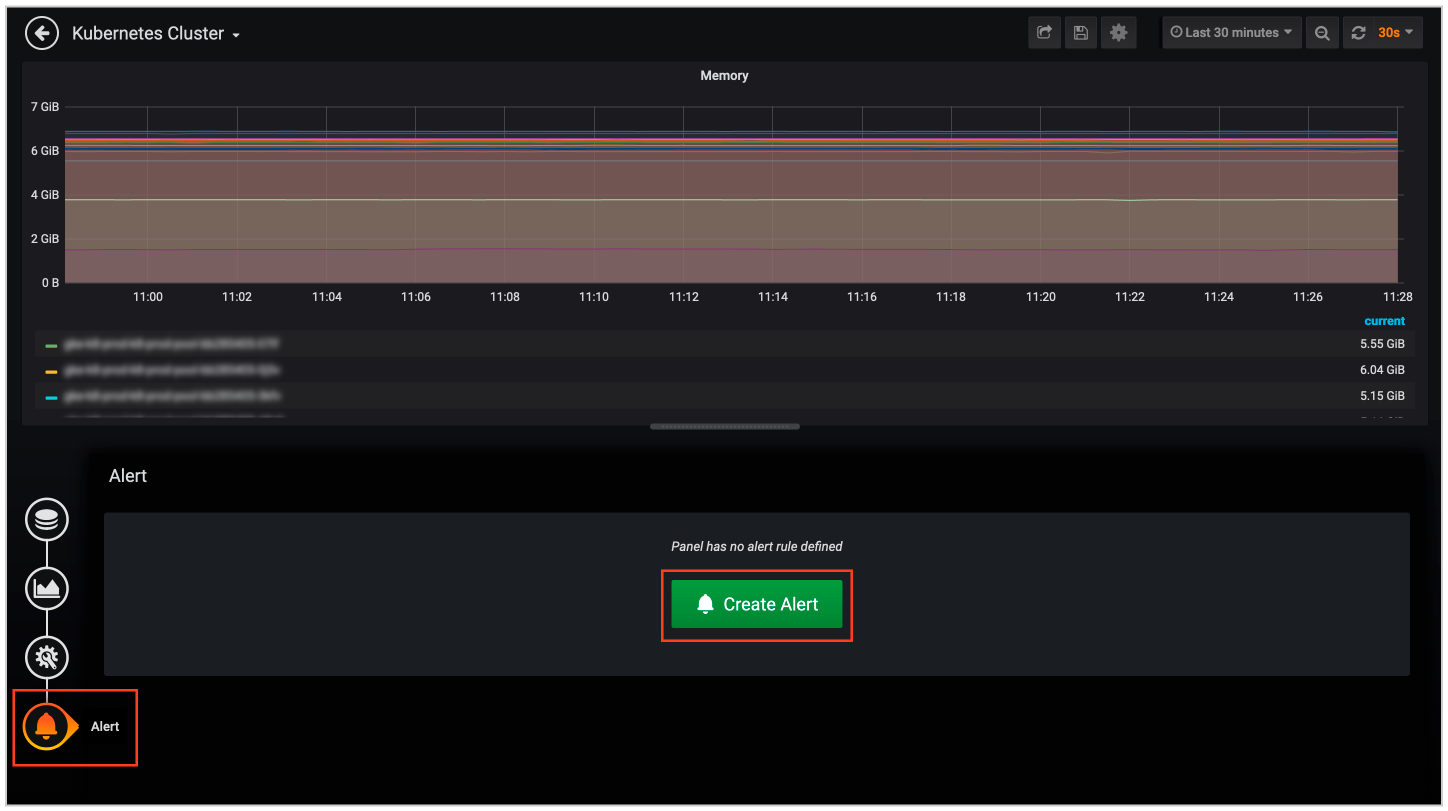
Under Alerts, click Create Alert button
To configure your alerts, set rules for when you want an alert triggered in the Rules section
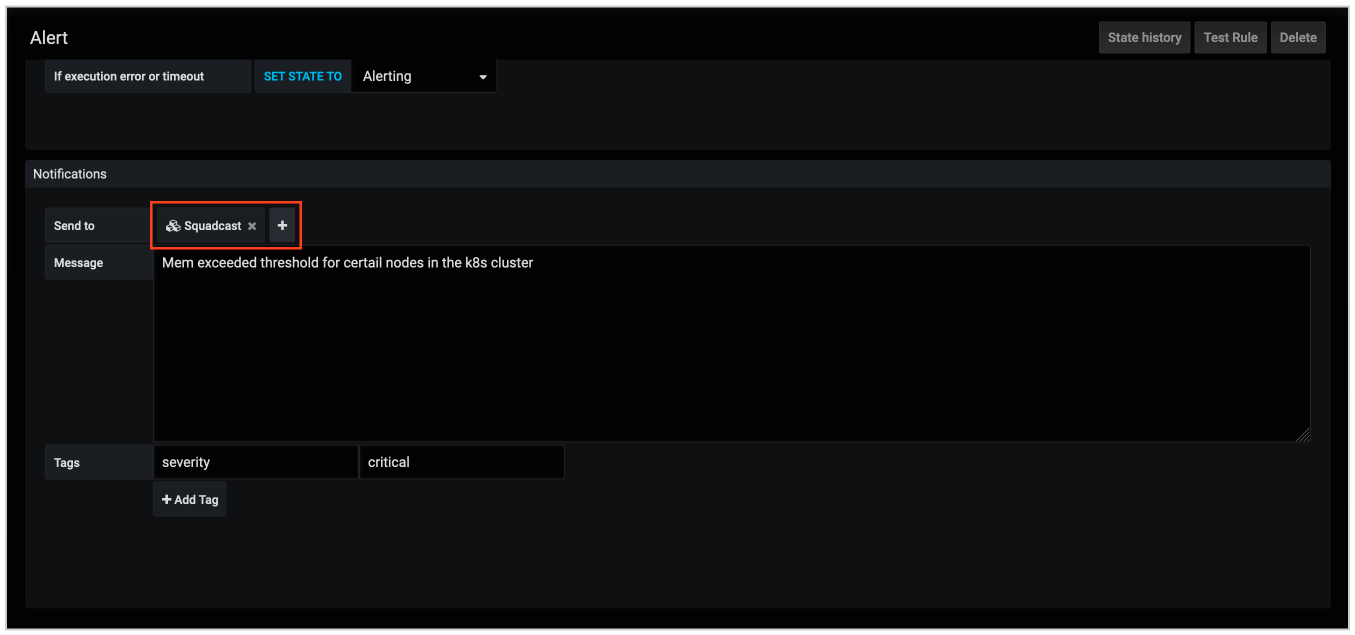
In the Notifications section, under Send to, search and add your previously saved Incident Response Webhook and enter a Message for the alert and save it. The message here will be your Incident Message in Incident Response. Ensure that this message is meaningful and provides an immediate context in an on-call scenario
Now, whenever an alert is triggered in Grafana for that particular panel, an incident will be created in Incident Response.
When it is resolved in Grafana, it will automatically get Resolved in Incident Response, provided the Disable Resolve Message checkbox is unchecked.\