Link - User Experience monitor
The Link - User Experience monitor locates and tests HREF links within a specified web page to ensure that the links can be successfully accessed by customers visiting your website.
Using this monitor, you can verify that:
- Any external links referenced by your website are available.
- Important resources you link to are not removed or changed.
- Dynamically-generated content references correct links.
The requested page can be comprised of static HTML or dynamic pages, such as Microsoft Active Server pages, Cold Fusion pages, or PHP Hypertext Preprocessor pages.
To simulate a customer session, the monitor performs the following steps:
- Connect to the web server. You can control whether ipMonitor connects to any or only a specific set of web servers. If required by the web server, the monitor transmits account and password information.
- Wait for a response within a required number of seconds.
- Receive the requested web page or resource using HTTP HEAD requests, and upgrades to GET if necessary when following links.
- Analyze the content of the web page to locate any internal or external links. The monitor skips specific resources to speed up analysis.
- Access each link sequentially on the page.
- Verify that the referenced link or resource is available.
Create a Link - User Experience monitor
- Click Devices in the toolbar.
- Locate and click the targeted device you want to monitor.
-
In the toolbar, click Add > Add New Monitor.
- In the Select Monitor menu, click Link - User Experience
-
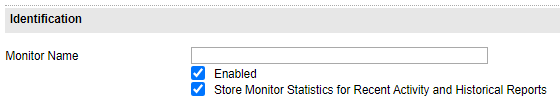
Under Identification, enter information about the monitor.
-
Enter a name in the Monitor Name field using up to 64 characters. This name will appear in the monitor list, monitor status, log files, and your reports.
You can change this name later, if necessary. ipMonitor does not use this field to internally identify this monitor.
-
Select Enabled to enable the monitor.
When enabled, the monitor tests the specified resource using the settings you enter under Test Parameters. You can disable the monitor later if required.
- Select Store Monitor Statistics for Recent Activity and Historical Reports to enable this functionality.
-
-
Under Test Parameters, enter the monitor testing parameters.
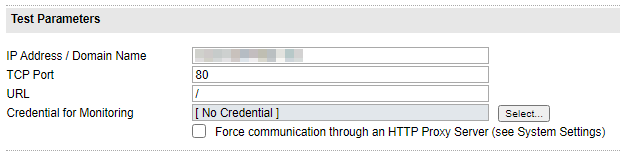
- Enter the IP address or domain name of the resource you want to monitor.
- Enter the TCP port number that the targeted resource responds on. The default is TCP port 80.
-
Enter the relative path to the resource you want to monitor beginning with a forward slash (/).
For example:
/notes/changelog.txt - Select a credential for monitoring. When selected, ipMonitor uses the credential account and password information to authenticate to the target machine and test the status of the drive or share.
-
(Optional) Select Force communication through an HTTP Proxy Server to monitor the HTTP resource through your HTTP proxy server.
Before you select this option, ensure that the ipMonitor global Client HTTP Settings selection in System Settings are set up correctly to allow communications with your proxy server.
-
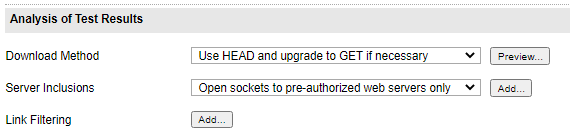
Under Analysis of Test Results, set up your download method, server inclusions, and link filtering.
-
Click the Download Method drop-down menu and select a method used by the QA Link monitor to request the target resource of each link found on the page.
If you want to... Select... Use the HEAD request Use HEAD and update to GET if necessary (default). If a connection fails, it upgrades to the GET method. For example, using HEAD requests can cause issues when used with CGI requests. Enable the web server to respond with the header and web page body when using the GET method Use only GET to download each link. Enable the web server to respond with the document header information when using the HEAD method Use only HEAD to verify each link.
Because the web page body is not included in the transaction, the HEAD method uses less bandwidth than the GET method.
-
Click the Server Inclusions drop-down menu and choose whether the monitor connects to pre-authorized web servers or any web server linked from the retrieved web page.
ipMonitor may communicate with unknown web servers.
Select Open sockets to pre-authorized web servers only and then click Add to enable the monitor to connect to servers you specify in the Domain / Host Name and TCP Port fields.

Select Open sockets to any web server to follow all links the monitor locates on the targeted web server. When selected, the Link - QA Monitor applies the following rules when following links:
- All HTTP links are considered valid.
- All links are tested sequentially based on their order within the file.
- When the monitor discovers an invalid link, the monitor fails and no proceeding links are verified.
- Every link is tested once.
- Links reference with a script (such as JavaScript or VBScript) are ignored.
-
Next to Link Filtering, click Add to instruct the QA Link monitor to ignore certain links or file types. This allows you to refine your test results.
-
Click the drop-down menu and select a match or search type. Click Regex Wizard to capture a specific substring within a file or text message.

-
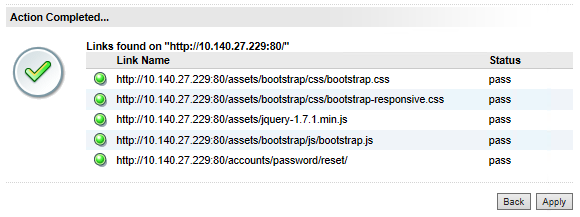
Click Preview to verify the Test Parameters and Analysis of Test Results settings before you go live.
Below is an example of the generated results.
-
-
Under Timing, configure the fields for the monitor testing states.
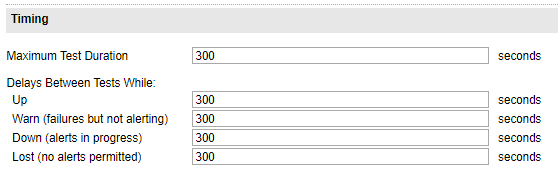
- In the Maximum Test Duration field, enter the maximum test duration rate (in seconds) that the monitor times out before the test is considered a failure.
-
In the remaining fields, enter the number of second between each test while the monitor is in an OK state (Up), a failed state while alerts are processed (Down), and a failed state and the maximum number of alerts have been processed (Lost).
In the Lost state, no additional failure alerts are processed. However, a recovery notification is sent if the monitor recovers.
-
Under Notification Control, complete the fields to determine how many test failures must occur before an alert is sent.
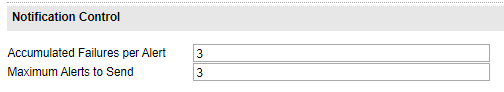
- Enter the number of test failures that occur for each alert before ipMonitor generates an alert for the monitor. The default option is 3.
-
Enter the maximum number of alerts to send before the monitor enters a Lost state.
The monitor must be assigned to a notification alert to generate an action.
-
Under Recovery Parameters, complete the fields to indicate the corrective action used to automatically restore a resource using the External Process Recovery, Reboot Server Recovery, or Restart Service Recovery action.
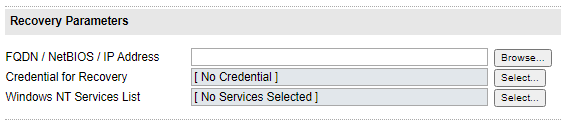
- Enter the Fully Qualified Domain Name (FQDN), NetBIOS, or IP Address of the machine hosting the service that needs a restart or the machine that needs a restart. You can also click Browse to locate and select the machine.
- Select the set of credentials used by the recovery alert. You can select a specific credential to execute recovery alerts that require access to restricted resources, such as Reboot Server, Restart Service, or External Process.
- Select the list of services to restart on the target machine specified in the FQDN/NetBIOS/IP Address field. This field is only required for the Restart Service alert. If a service has dependencies, select all dependent services.
- Click OK.
Test results
| Test Result | Description |
|---|---|
| Links | The total number of links checked during the last monitor test. |
| Blocked | The total number of links not checked by the monitor during the last test. This value is directly based on the Server Inclusions and Link Filtering settings in Analysis of Test Results. |
|
Kps |
Indicates the web server's transfer data rate. |