Identify blocking sessions and deadlocks with DPA
DPA provides information to help you determine if blocking sessions and deadlocks are affecting performance, and to investigate the root cause of these issues. See the following sections:
- Identify blockers causing the longest waits
- Find the last activity of an idle blocker
- Investigate deadlocks on SQL Server instances
Identify blockers causing the longest waits
Are blocking sessions causing performance problems in your environment? Use the Blocking tab to identify the root blockers, find out which SQL statements are being blocked, and determine which blocking sessions are responsible for the longest overall waits. DPA shows the aggregated wait time for each blocker, which helps you focus your tuning efforts on blockers with the largest impact.
To view information about blocking sessions:
- From the DPA home page, click a database instance name to display the Trends charts.
-
If necessary, click a bar on the chart to drill down to the time period you're interested in.
By default, the initial time period is the past 30 days of DPA data collection. You can drill in to a Trends chart to view a more specific period.
-
Click the Blocking tab below any trends chart to view correlated information about blockers during that time period.
The size of each segment in a bar provides a visual indicator of the waits that session caused.

Find the last activity of an idle blocker
Idle blockers can be difficult to diagnose because they are currently not performing any activity in the database. To help you find and fix the root problem, use DPA to determine what that session was doing before it became idle.
- From the DPA home page, click a database instance name to display the Trends charts.
-
Click a bar on the Top SQL Statements chart to drill into a day, and then click a bar to drill into an hour.
DPA displays information about the type of waits experienced during that hour.

-
Click the Blockers tab above the chart to see a list of the blockers for that time period.
-
Expand a blocker to see information about the waits it caused.
Each idle blocker row has a Find Last Activity link on the right.

-
To find out what a blocking session was doing before it went idle, click Find Last Activity.
The Find Last Activity dialog tells you when the last activity occurred.

- Click one of the following buttons:
- Annotate and View Activity: Displays the activity and annotates the SQL statement to make it easy to find in the future.
- View Activity: Displays the activity without annotating the SQL statement.
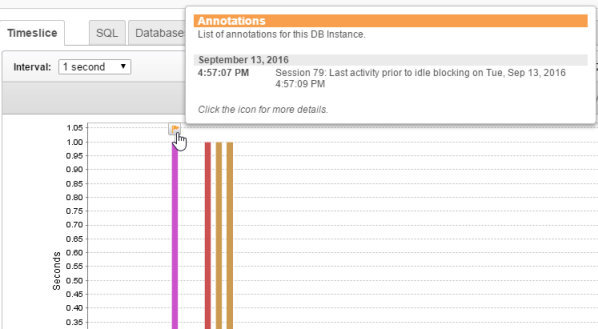
The Timeslice tab shows a bar representing the last SQL statement executed by the idle blocker. You can drill in to investigate further.

Investigate deadlocks on SQL Server instances
Deadlocks occur when two sessions have a lock on different resources, and each session needs the resource of the other to complete its task. For example:
- Session 1 has a lock on Table A.
- Session 2 has a lock on Table B.
- Session 1 requests a lock on Table B, but it is blocked by Session 2.
- Session 2 requests a lock on Table A, but it is blocked by Session 1.
One session (the victim) eventually releases its lock and does not complete its task. The transaction time that the victim spent in contention is a good measure of the impact that the deadlock had on performance.
For monitored SQL Server database instances, DPA provides detailed information about deadlocks, including the Victim Impact (how long the deadlocked transactions ran).
- From the DPA home page, click a database instance name to display the Trends charts.
- If necessary, click a bar on the chart to drill down to the time period you're interested in.
-
Click the Deadlocks tab below any Trends chart to see the latest deadlocks for that time period.

- Click the link in the Time column to open the Deadlock Details page, which includes the following sections:
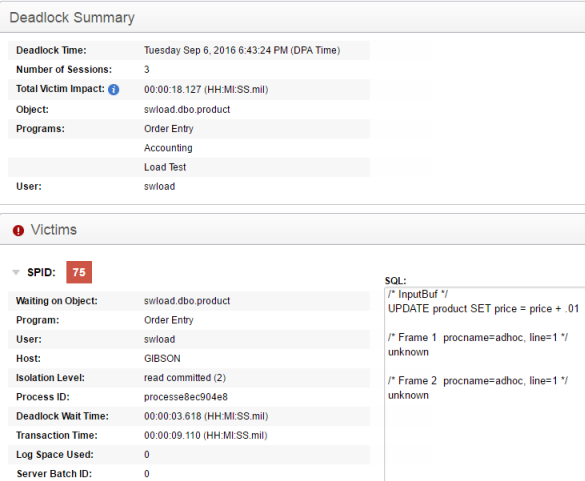
- The Deadlock Summary section shows high-level information, including the Total Victim Impact.
- The Victims section shows details about the queries that were rolled back.
- The Survivor section shows details about the query that was completed.
- The Deadlocked Resources section shows the type of lock and the lock mode. Click the links for expert advice.

For information about preventing deadlocks, see the "Resolve deadlocks" section of Deadlock analysis in DPA.
