Monitor compliance with the SCM policy engine
SCM offers a policy engine that enables you to monitor compliance of your servers, databases, and applications. Using policies in SCM, you can assign rules to nodes. These rules can have single or multiple conditions. You can also open an out-of-the-box policy and disable a rule for all nodes if desired. Pre-conditions determine whether specific rules are applicable. Compliance with rules is evaluated once per day and on demand.
Your organization should internally review and assess to what extent, if any, such policy should be incorporated into your environment and how you can best ensure compliance with your internal policies. All policies contain a subset of rules deemed automatable by SolarWinds. SolarWinds makes no warranty, express or implied, or assumes any legal liability or responsibility for the policies contained herein, including the accuracy, completeness, or usefulness of any information.
Understand the rule evaluation flow
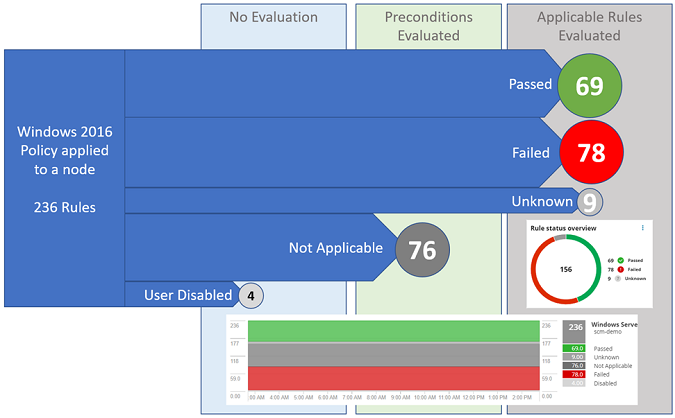
SCM evaluates configurations from files, commands, and registry settings against the benchmark specified by each rule. If a rule is applicable to a configuration, the result displays a Passed, Failed, or Unknown status. Then SCM summarizes your compliance using percentages, which are displayed through various dashboards and views. An illustration of the rule evaluation flow is shown below.
Assign or unassign policies to nodes
From Server Configuration Monitor Settings, click the Policies tab to view the out-of-the-box policies. Select a policy, assign or unassign it to one or more, and enter credentials (if desired).
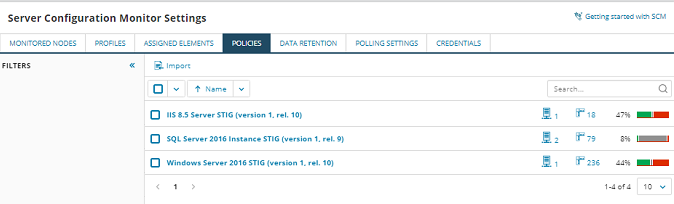
Policy import and export functionality is available on this tab. It uses the YAML format. You cannot import a policy with the same name or unique ID as an existing policy. When additional policies become available, they will be published on the SCM Thwack exchange forum.
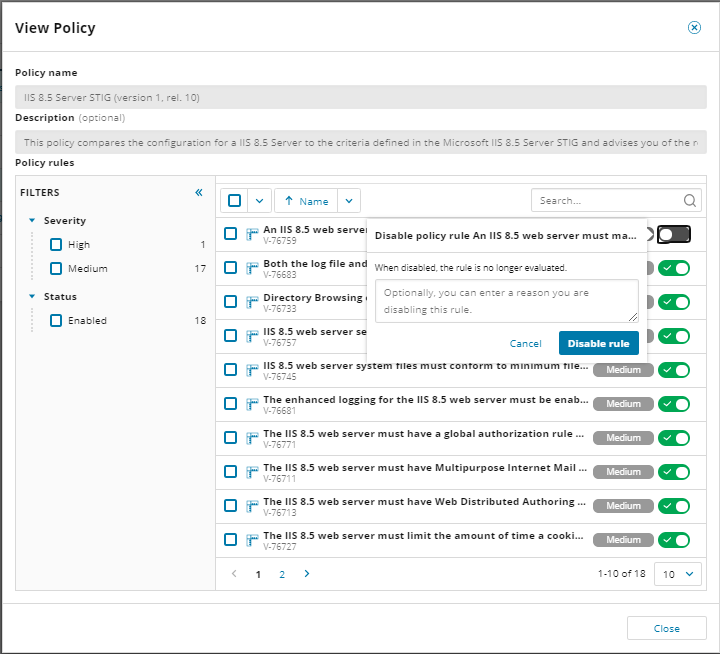
You may view the policy details, which include rules details, by selecting the policy and then clicking View details.
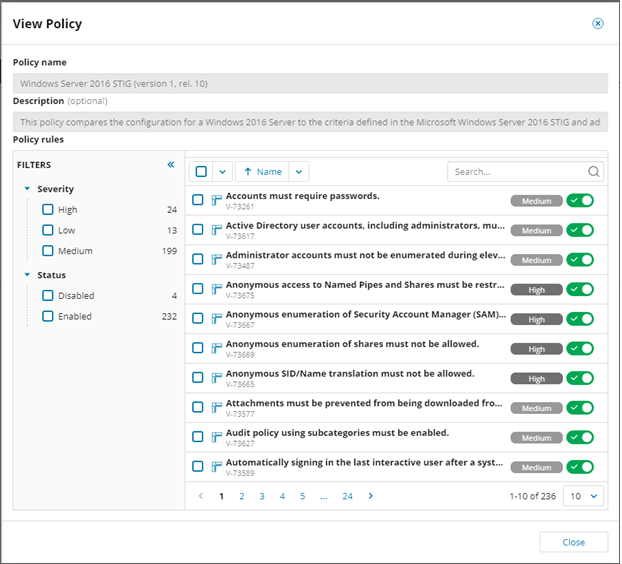
You can globally disable or enable a rule by toggling the green button (if currently enabled) or black button (if currently disabled). Optionally, you can enter a reason for disabling a rule. You cannot disable a rule on only some nodes; it must be a global change.
See additional policy dashboards and views
The SCM policy engine dashboards described below contain the following four types of widgets:
- Policy compliance shows the percentage of passed rules out of all evaluated rules (rules with Passed, Failed, or Unknown status).
- Rule status overview shows the distribution of Passed, Failed, or Unknown statuses. (Not applicable and Disabled statuses are hidden.)
- The Policies table displays a list of policies with compliance percentage, rule counts, and node counts.
- You can drill down to Policy compliance summary or to Rule explorer (with pre-filtered status).
- <status> rules are tables filtered by status that display policy name, ID, and severity.
- Rules with Unknown status have an additional column called Problems that shows the number of errors during polling or evaluation, or it may display a dash to indicate that the Unknown status is not due to an error, but was simply not polled yet. A dash may also indicate that the rule could only be partially evaluated and requires additional manual input or checks. In such cases, the Unknown status is a result of the evaluation process even though no errors occurred. Users can get rid of these Unknowns by disabling the rule globally.
- Rules with a Disabled status are rules that have been globally disabled. There is an additional column displayed with these rules to indicate the reason they were disabled if the user enters that information.
- Links in these tables navigate either to Rule details or Assigned rules details.
Overall compliance summary
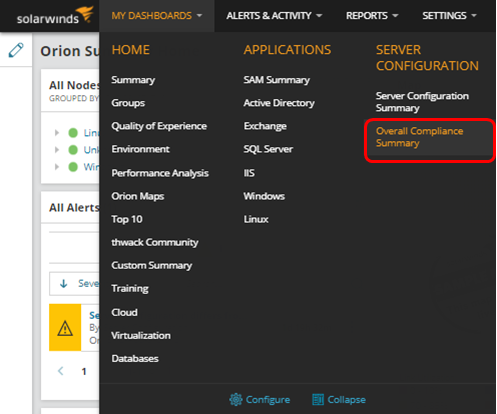
To view the overall compliance summary, click My Dashboards, and then under Server Configuration, click Overall Compliance Summary.
The Overall Compliance Summary dashboard includes only applicable rules and provides a high level summary as follows:
- The Overall compliance percentage of passed rules
- The Policies table, which includes policy names, number of nodes assigned to policies, compliance percentage, the number of Unknown rules, and the number of Failed rules
- The Rule status overview pie chart
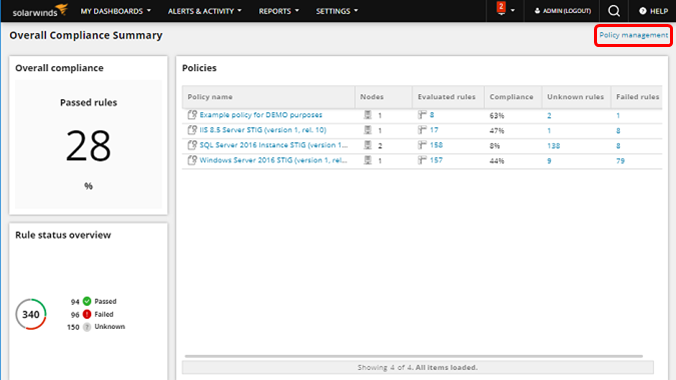
If you click the Policy management link at the top right of the page, you are directed to the Server Configuration Monitor Settings Policies tab, where you can assign, unassign view details, import, and export policies.
If you click the link to a policy names within the Policies table, you are directed to that Policy compliance view.
If you click the links in the Evaluated rules, Unknown rules, and Failed rules columns within the Policies table, you are directed to the Rule explorer.
As noted, if rules are disabled or are not applicable, they are not included in the overall compliance dashboard, but they do display in Perfstack, which shows results for all rules. See Policy compliance in Perfstack for further details.
Policy compliance
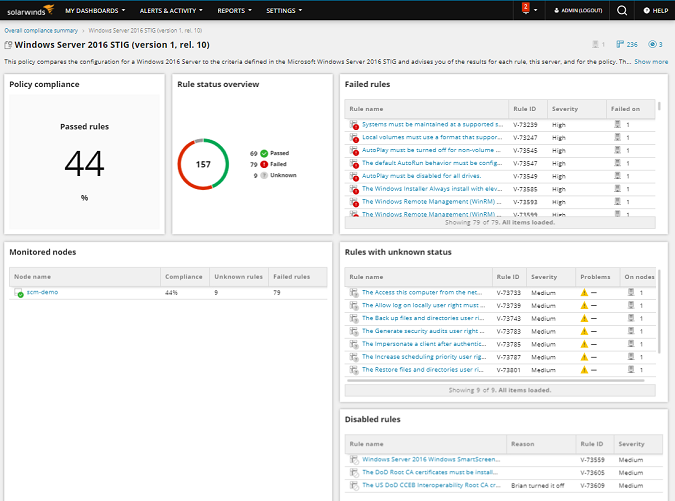
Each policy compliance page shows the percentage of Passed rules, the Rule status overview, Monitored nodes, a table of Failed rules, a table of Rules with unknown status, and a table of Disabled rules for that policy.
If you click the linked node under Monitored nodes, you are directed to the Policy node compliance view for that node.
Policy node compliance
The Policy node compliance view displays the Policy compliance percentage, the Rule status overview, a table of Rules with unknown status, a table of Passed rules, and a table of Failed rules, a table of Disabled rules, and a table of Not applicable rules ---- all for that policy on that node. It also shows a timestamp of when the evaluation took place.
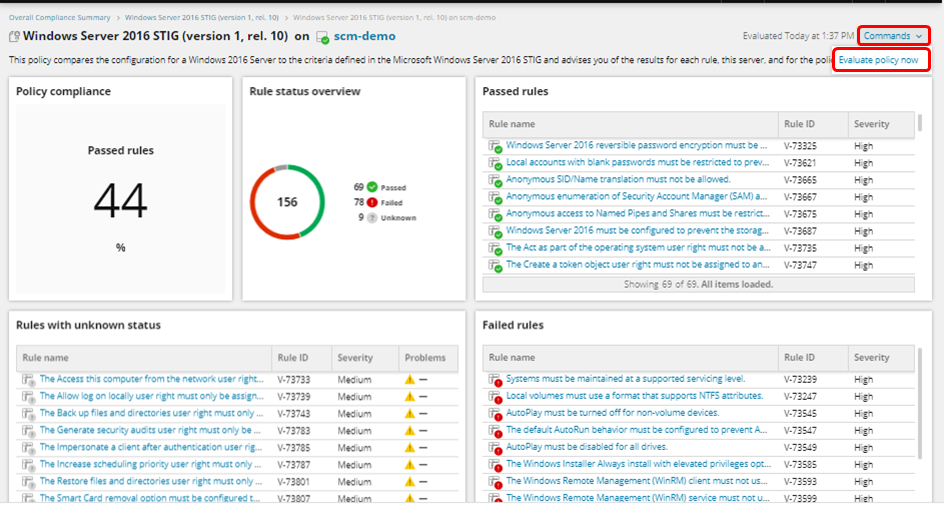
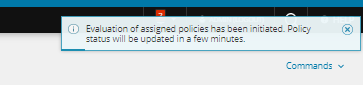
If you click the Commands drop-down menu in the top right corner and select Evaluate policy now, you see the following message:
If you click the link to the node near the top of the Policy node compliance view, you are directed to the Node details subview.
Node details subview
The Node details subview provides a view of a multiple policies assigned to a single node. It shows you the Policy compliance percentage, the Rule status overview, a table of Rules with unknown status, a table of Policies to which that node is assigned, a table of Failed rules, and a table of Rules with unknown status.
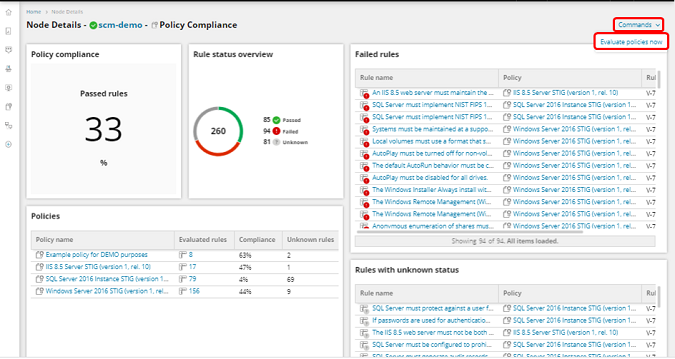
If you click the Commands drop-down menu in the top right corner and select Evaluate policy now, you see the following message:
If you click a Rule name link in one of the Rules tables, you are directed to the Rule details view for that rule.
Rule explorer
The Explorer: Policy rules view provides filtering options by Policy name, Rule status, and Severity. It also shows you a list of all rules (not assignments), their IDs, Severity, the number of nodes assigned to them, and a percentage of compliance. Each rule is listed only once, regardless of the number of its existing assignments. The compliance of the rule is computed over all nodes its policy is assigned to. The status of the rule is a combination of all assignments, and is prioritized in order from worst to best status (for example, Failed > Unknown > Passed > Not applicable > Disabled). Rules are searchable by keyword or ID number in the search box at the top right of the list of policies.
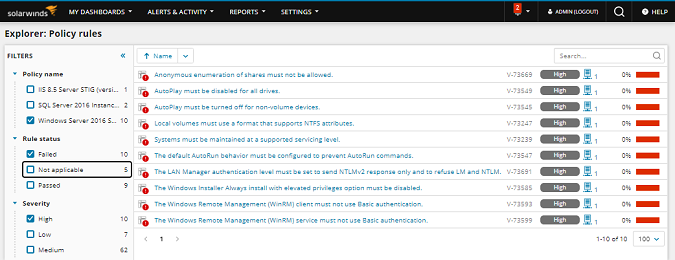
If you click one of the Rule name links, you are directed to the Rule details view.
When you select a rule, a side panel with a Policy rule detail tab displays. (It contains the same information as Policy rule detail in to the Rule details view.) This side panel also includes an Evaluation tab.
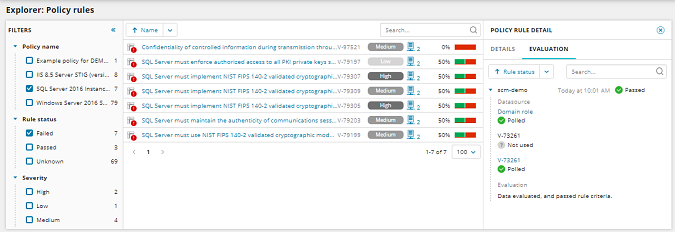
The Evaluation tab lists all assignments to nodes. Each node lists the last status of each data source polling and rule evaluation.
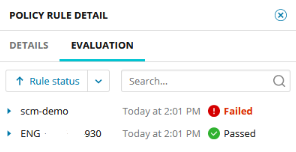
Each data source can have one of the following statuses:
| Status | Reason |
|---|---|
| Not used | The data source was polled but not required for evaluation (one branch or an !any operator with one of the previous branches marked as Passed). |
| Polled | The data source was polled and used for evaluation. The link navigates to the SCM diff page, which shows the differences between the two most recent versions. |
| Not polled yet |
The data source is still polling after being assigned. |
| Not found |
The file or registry key was not found. |
| Issue (with specific error type title) | There was an error during polling of the data source. |
The evaluation can have one of the following statuses next to the node name and description in the Evaluation segment:
| Status | Description |
|---|---|
| Unknown | Data evaluated, but the rule status is ambiguous. Additional documentation or manual input may be required. Please read the rule definition. (This typically occurs when the rule is not fully automatable.) |
| Unknown | No data to evaluate. Some required data sources could not be polled (when there was an error during polling). |
| Unknown | Evaluation failed Show more details (when there was an error during evaluation). |
| Passed | Data evaluated and passed rule criteria. |
| Failed | Data evaluated but failed rule criteria. |
| Disabled | Evaluation not executed for disabled rule. |
| Not applicable | Evaluation not executed. The rule is not applicable for this node. For instance, some rules are applicable only to Domain Controllers. |
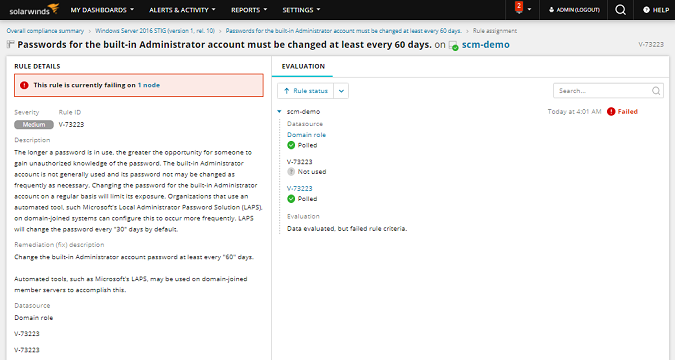
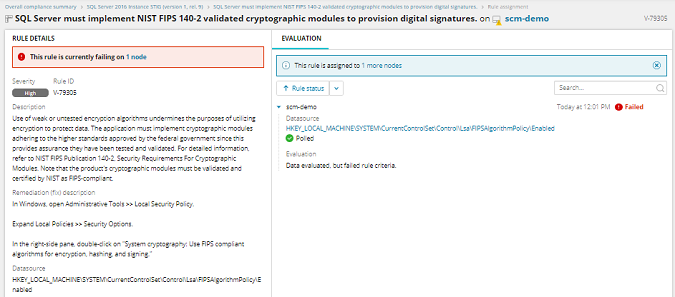
Rule details
The Rule details view provides the status, severity, ID, a description of the rule, and a remediation (fix) description for that rule.
The various possible statuses are shown below.
| Status | Reason | Pie Chart | Perfstack |
| Passed | Rule was evaluated and Passed | Yes | Yes |
| Failed | Rule was evaluated and Failed | Yes | Yes |
| Unknown |
Rule was not evaluated because:
|
Yes | Yes |
| Not Applicable |
This rule doesn't apply to this entity
|
No | Yes |
| Disabled | User explicitly disabled this rule | No | Yes |
Assigned rule details
The Assigned rule details view provides the status, severity, ID, a description of the rule, and a remediation (fix) description for that assigned rule.
Policy compliance in Perfstack
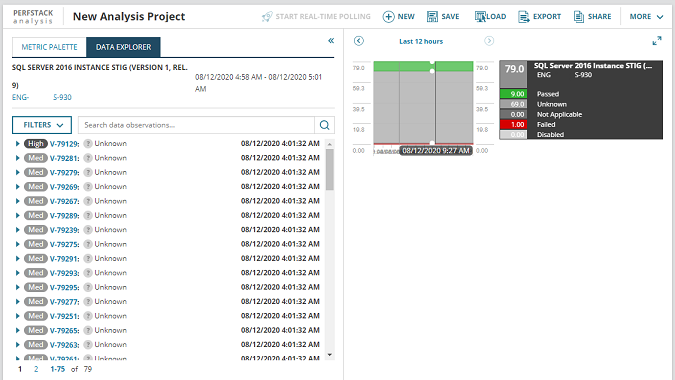
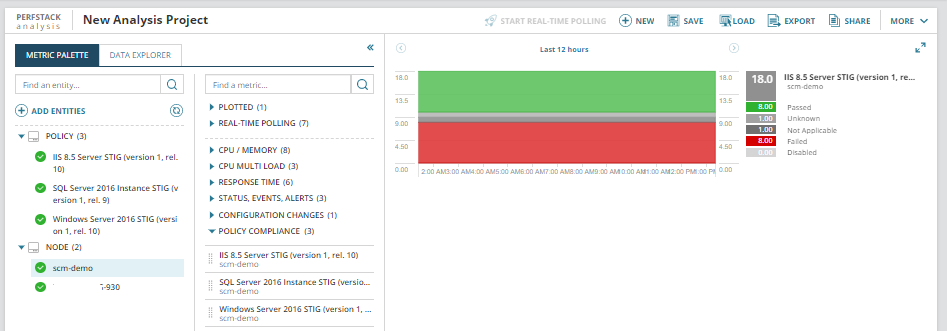
To view data in Perfstack, go to Dashboards, and click Performance Analysis. From the Metric Palette tab, click Add Entities to select and add one or more nodes. To add a policy, click Add Entities, and the click the Node drop-down menu. Click All, and a comprehensive list displays from which you can select and add one or more policies.
Click the arrow next to Node to expand the view. A new column displays to the right. Click the arrow to expand Policy compliance, and all of the out-of-the-box policies display. Drag and drop the policies you want to view in the field to the right.
You can also click the arrow next to Policy in the left column. Then under Policy compliance, drag and drop one or more policies into the field at the right.
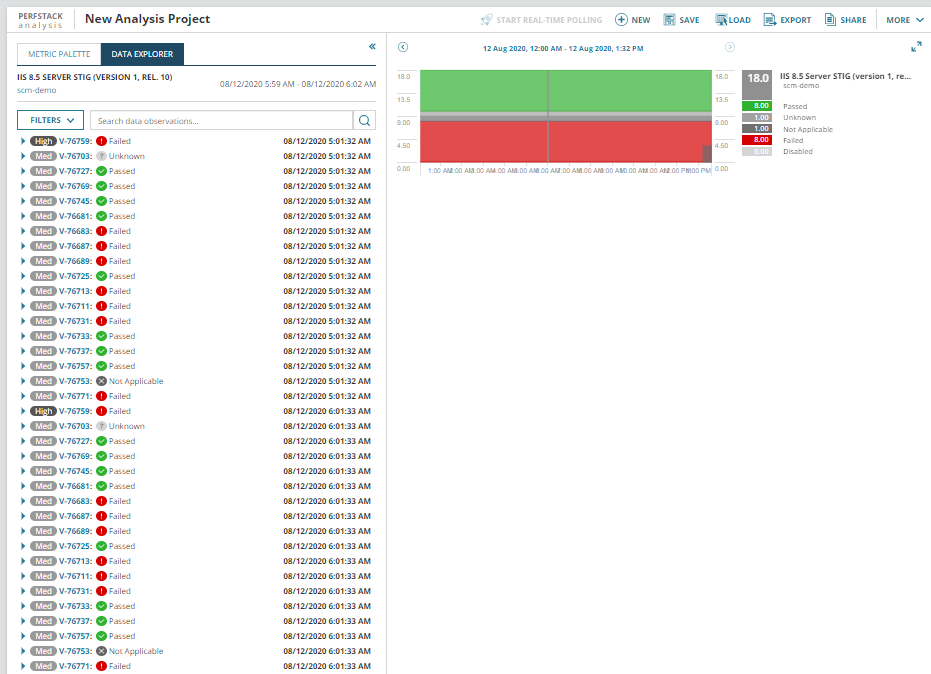
If you click on any of the data points in the graphs, the Data Explorer displays. It shows everything that was evaluated in the graphs. You can filter that data to display any specified status or severity level. Each row in the Data explorer is expandable and can provide rule details. You can drill down to the rule, policy, and node.
Perfstack provides data for both node and policy entities. Rather than percentages, Perfstack shows compliance in counts. Even if rules are disabled or are not applicable, they are still included in Perfstack, which shows results for all rules. In the Data Explorer tab, you can click on links to view rule details, nodes, and policies. You can see the number of nodes in each status per policy. This is the only view in SCM that presents historical data. Note that historical data is available for assigned policies only. If a policy is unassigned, the data is removed from the database.
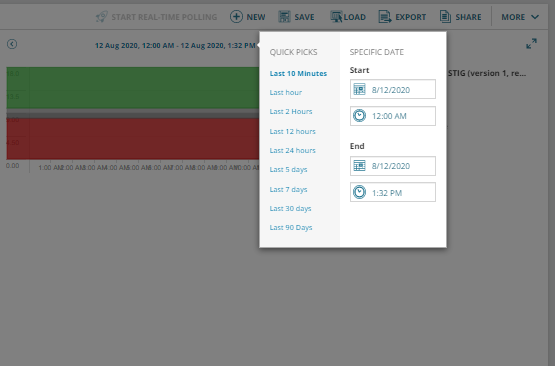
You can select a date and time range to view in Perfstack by clicking the linked time frame above the graphical data.
You can click any data point on the graph to view a list of rules and statuses in the selected data and time range.
Instead of displaying historical data for a policy that shows all assignments, you can also choose to show node compliance with a specific policy. In this case, only policies assigned to that node are displayed.
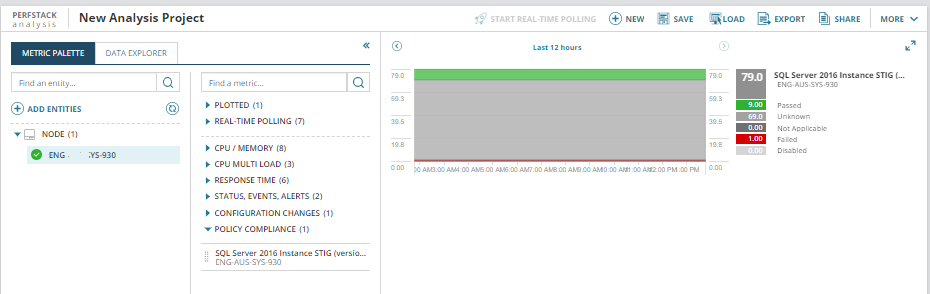
You can drill down to see a list of rules and statuses by clicking on any data point in the graph.