Set up the dashboard
Use the dashboard to create and view pie chart, bar graph, and text widgets that display your ticket statistical data. These widgets display trends in specific ticket categories (such as Ticket Status and Alert Condition) to help you locate issues that could impact your help desk and corporate operations.
You can configure three types of widgets: Ticket Chart, Ticket Activity, and What's New.

You can access the widgets from the Widget Drawer. Click Open Widget Drawer in the dashboard to display all available widgets.
Ticket Chart widget
The ticket chart widget displays your ticket metrics in pie or bar charts. Each chart type identifies the total number of selections in a specific category.
Widgets can generate a warning message if the data cannot be processed within 15 seconds. See Ticket Chart performance limitations for details.
Create a ticket chart widget
-
In the toolbar, click Tickets > Dashboard.

-
In the dashboard, click Open Widget Drawer.
-
Select Ticket Chart Widget.

- Click and drag the widget header to the dashboard.
- Resize the widget to your desired size. Use the blue snap-to guide to ensure that the widget is sized correctly.
-
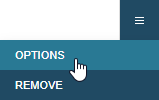
Click the drop-down menu icon and select Options.
-
Select your chart options. To import the chart data into a spreadsheet, click the Raw Data icon and copy the data in the window to an external file. When you are finished, close the window.

-
Click Save. The widget displays in the dashboard with your selected category in the header.
For example, you can select Request Type in the Category drop-down menu and Pie as the Chart Type selection. When you save your options and then hover your mouse arrow over a pie slice, a pop-up window displays the total number of tickets by tech group.

-
(Optional) Select the Hide Headers check box to hide all widget headers.

-
Click Close Widget Drawer.
Chart types
You can select a pie chart or horizontal bar chart.
The pie chart divides each ticket category into slices that illustrate the numerical proportion of your tickets. You can restrict the chart data by clicking a legend item to remove the category from the chart. For example, if you click a legend item, the legend color changes to white and the chart only displays Open and Pending ticket information.
Double-click a legend option to disable all categories except your selected category.

The horizontal bar chart displays your ticket categories using color-coded bars. Each category includes a separate bar color and corresponding data value.

Ticket chart options
To configure your widget options, click the options drop-down menu. The Ticket Chart Options window opens, and you can configure all available options to display in the chart.

The window includes a widget preview that displays your data in real time. When a data parameter changes, Web Help Desk implements a new database call and updates the chart to reflect the changes. If your ticket chart options include a complicated request, the chart may require additional time to process the request.
Select a Category option to filter your ticket data by request type (such as Status). The Query option filters your category results through a condition or qualifier that you set up in Advanced Search.
For example, you can set up a query that searches your Web Help Desk database for all tickets opened within the last 30 days and save the query as Opened within 30 days.

To share your query with all techs, select the Shared check box in the tab window. When you select the query in the Query drop-down menu, an asterisk (*) displays next to the query and indicates the query is shared with all techs.
When you select this query in the Query menu and Status in the Category menu, the chart preview displays the number of tickets by status opened within the last 30 business days. An asterisk (*) displays next to the query and indicates the query is shared with all techs.

If you select Horizontal Bar, the Show non-zero items only check box displays. Select this check box to display all categories with values greater than zero only.
After you select the chart type and the number of top items to display in the chart, click Save to display the chart in your widget. You can also export the raw data to an external file.
Web Help Desk refreshes the Ticket Chart widget every 60 seconds.
View tickets by category and status
When you click a pie slice or horizontal bar, Web Help Desk displays all associated tickets. For example, when you click the Open pie slice, Web Help Desk displays all open tickets opened within the last 30 days with an Open status. The widget title reflects the selected category and category value.

To adjust the number of displayed tickets, click the Items per Page drop-down menu. If you need to search for a specific term in the page, press Control + F and enter your search term to highlight it in the page.
View a selected ticket
You can view an individual ticket by clicking a ticket in the window. For example, if you click ticket 12, Web Help Desk opens the Search Tickets option and displays ticket number 12 on your screen.
Click ![]() to return to the Dashboard. If you click the browser Back arrow, you return to the Dashboard main page, but you lose your search results.
to return to the Dashboard. If you click the browser Back arrow, you return to the Dashboard main page, but you lose your search results.
Ticket chart performance limitations
The Category drop-down menu in the Ticket Chart Options window include the following categories:
- Alert Level
- Alert Condition
- On-time Status
- First-Call Resolution
These categories may require an extended amount of time to query the Web Help Desk database, process the results, and display the results in the chart. If these categories cannot be processed within 15 seconds, the system times out and displays a warning message.

To minimize this issue, create and save a query in Tickets > Search > Advanced Search to reduce your search results. When you are finished, add the query to your widget options. This method reduces the amount of data processing required by the Web Help Desk database and prevents a warning.
For example, you can create a query in the Tickets > Search Tickets > Advanced Search tab that locates all tickets created within the last month. When you are finished, save the query with a corresponding name (such as Open within 30 days).
To share the query with other techs, select the Shared check box. When you configure your ticket chart options, the shared queries displays in the Query drop-down menu with an asterisk (*).
Ticket Activity widget
The ticket activity widget displays the recent changes applied to your tickets. These changes include:
- Tech notes
- Client notes
- Emails
- Assignments
- Escalations
- De-escalations
- Others
Web Help Desk refreshes this widget every 60 seconds.

Ticket Activity options
You can configure the ticket activity widget by clicking Options in the widget drop-down menu. This opens the Ticket Activity Options window where you can configure all available options that display in the chart. The window includes a chart preview that shows you how the chart will display in the widget based on your selected options.

You can select one or more activity types, select a query to narrow your search results, and select the number of items that display in the Ticket Activity window. Additionally, you can export the widget data to an external file.
Ticket Activity message icons
The following icons display in the ticket activity widget to indicate a problem or action in the ticket.
| Icon | Description |
|---|---|

|
Web Help Desk cannot send an email to the client. |

|
The ticket is assigned to a tech. |
|
|
The ticket includes a new note. |
|
|
The ticket was de-escalated. |
|
|
The widget is collecting ticket data. |
|
|
The ticket includes a new tech note. |
Create a Ticket Activity widget
-
In the toolbar, click Tickets > Dashboard.
-
In the dashboard, click Open Widget Drawer.
-
Select Ticket Activity.

- Click and drag the widget header to the dashboard.
- Resize the widget to your desired size. Use the blue snap-to guide to ensure the widget is sized correctly.
-
Click the drop-down menu icon and select Options.
-
Select the appropriate options in the Ticket Activity Options window, and then click OK.
The widget displays in the dashboard.
You can select the Hide Headers check box to hide all widget headers
-
Click Close Widget Drawer.
What's New widget
The What's New widget lists the new features included with your release. This widget does not include any configuration options.
Create a What's New widget
-
In the toolbar, click Tickets > Dashboard.
-
In the dashboard, click Open Widget Drawer.
-
Select What's New.

- Click and drag the widget header to the dashboard.
-
Click Close Widget Drawer.
-
Resize the widget to your desired size. Use the blue snap-to guide to ensure all widgets are the same size in your dashboard.
The widget is resized in the dashboard. No configuration is required.
Export the widget data to an external file
-
In the toolbar, click Tickets > Dashboard.
- In the dashboard, choose a ticket chart widget to export the data.
-
In the widget, click the drop-down menu icon and select Options.
-
Click the Raw Data icon.
- Copy and save the data to an external file.