Create asset reports
Asset reporting can help you manage organizational assets by providing the statistics you need to make informed decisions. You can build real-time reports for multiple assets based on your selected features.
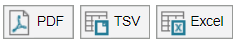
The Reports tab includes several predefined asset reports you can use to generate a report. Click a report template or create your own customized report. The report types include bar chart, pie chart, and table-only reports. If you have multiple assets, you can export the asset data to a consolidated report, such as a PDF, TSV, or Excel file.
-
In the toolbar, click Reports.

-
In the Reports tab, ensure that the Override Dates option is deselected unless required. Otherwise, your report will not reflect your targeted dates.

-
Click a predefined report template in the Reports column, and then go to step 9.
To create a custom report, go to the next step.
-
Click New.

-
In the Report Basics tab, enter a name that identifies the report. The report name will display in the report title.

-
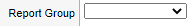
(Optional) Click the Report Group drop-down menu and select a report group. Applying a report group can make reports easier to find when you have several reports.
-
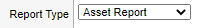
Click the Report Type drop-down menu and select Asset Report.
-
Click Save.
- Select the type of report to create:
If no report groups are available, the default report group is Sample Reports. To create a new report group, save the information currently in the Report Basics tab and see Create report groups to learn how to build report groups.
To apply the new report group to a report, select the report from the list of Web Help Desk reports, click Edit, and then select the Report Group.
Create a bar chart asset report
-
In the Chart Type row, select Bar Chart.

- Click the Bar Category drop-down menu and select an option.
For example, if you select Model, the bar chart includes all assets by model.

-
Click the Bar Stack Category drop-down menu and select Asset Type to specify the data stacked on each bar.

-
(Optional) Select the Draw as percentages checkbox to display the bar stack categories with percentage values. Otherwise, leave this checkbox unchecked.
-
Click the Repetition Category drop-down menu and select a category used to create multiple charts.

For example, if Repetition Category is set to Location, a separate chart (along with a table, if specified) generates for each location.
- Click the Show in table drop-down menu and select how many items to display for the category.
-
Select the Chart Metric attribute used to determine the bar lengths or size of the pie chart slices. For example, if you select Asset Count, each bar or pie slice reflects the number of assets for a specific category.

-
Select the Order By Chart Metric checkbox to include a table of values in the report. The values include hyperlinks to the corresponding assets or tickets. Otherwise, leave this checkbox unchecked.
-
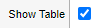
Select the Show Table checkbox to include a table of values in the report. The values include hyperlinks to the corresponding assets or tickets. Otherwise, clear this checkbox.
-
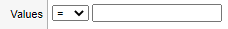
Select the targeted values for this report.
-
Select the Show Filters checkbox to include the list of configured filters for this report. Selecting the checkbox does not affect how the data is filtered, but only whether the filter list is visible in the report. Otherwise, leave this checkbox unchecked.
-
Select the Show Non-Zero Items Only checkbox to include only data with asset numbers different than zero. Otherwise, clear this checkbox unchecked.
- (Optional) Add a report filter.
- Click the Report Filters tab.
- Click New.
Click the Filter Attribute drop-down window and select an option.

For example, if you select Model, the report filters all assets by model.
- In the Report Details window, click Save.
-
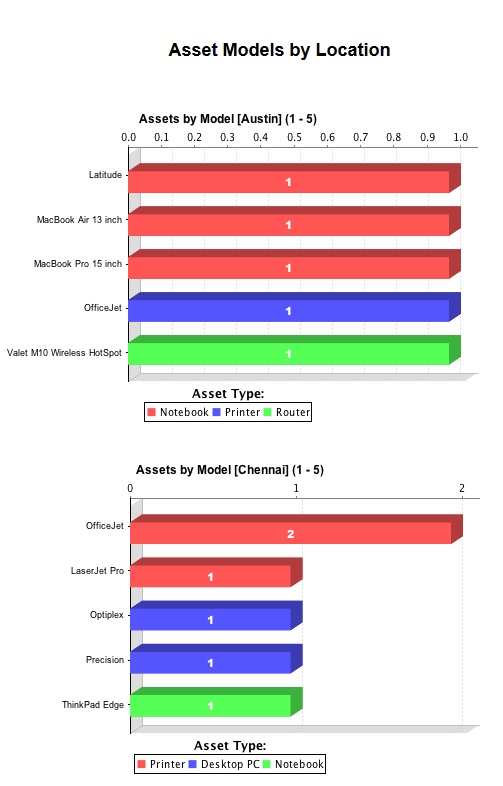
Click Run Report to generate the report.
The report displays, as shown in the following illustration.
Create a pie chart asset report
-
In the Chart Type row, select Pie Chart.

-
Click the Pie Slice Category drop-down menu and select an option to indicate which data the pie slices represent.

- Click the remaining drop-down menus and select the number of items that display in the table and chart. For the best illustration, keep the number of items shown in the pie chart to 15 items or less. If you need to add more than 15 items to a pie chart, consider using a bar chart instead.
-
Click the Repetition Category drop-down menu and select a category used to create multiple charts. For example, if Repetition Category is set to Location, a separate chart (along with a table, if specified) generates for each location.
-
Select the Chart Metric attribute used to determine the bar lengths or pie-slice sizes. For example, if you select Asset Count, each bar or pie slice reflects the number of assets for the targeted category.

-
Select the Show Table checkbox to include a table of values in the report. The values include hyperlinks to the corresponding assets or tickets. Otherwise, clear this checkbox.
-
Select the targeted values for this report.
-
Select the Show Filters checkbox to include the list of configured filters for this report. Otherwise, clear this checkbox.
-
Select the Show Non-Zero Items Only checkbox to include only data with asset numbers different than zero. Otherwise, clear this checkbox.
-
(Optional) Add a report filter.
Report filters restrict the tickets included in the report by specifying the attribute values that should be excluded. For example, a Status Type filter could restrict the report to Open or Pending status types. Click the Help icon in the Report Filters tab for more information.
- Select the Report Filters tab.
- Click New.
-
Click the Filter Attribute drop-down window and select an option.
If your filter attribute is identical to the report category, only the values allowed by the filter appear in the report.
For example, if you select Model, the report filters all assets by model.
- In the Report Details window, click Save.
-
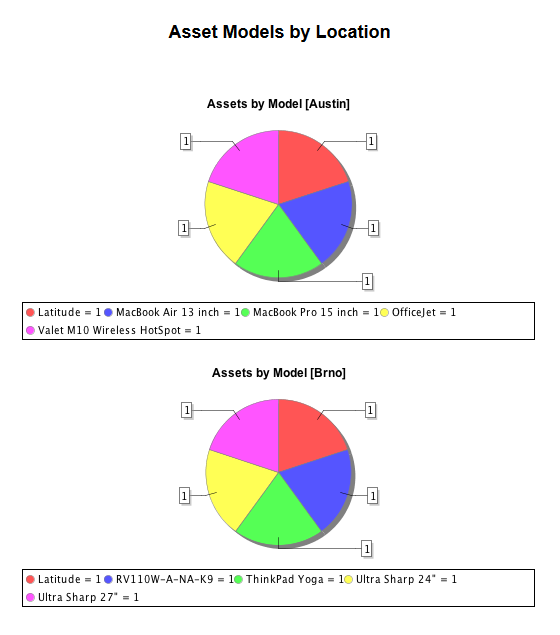
Click Run Report to generate the report.
The report appears, as shown below.
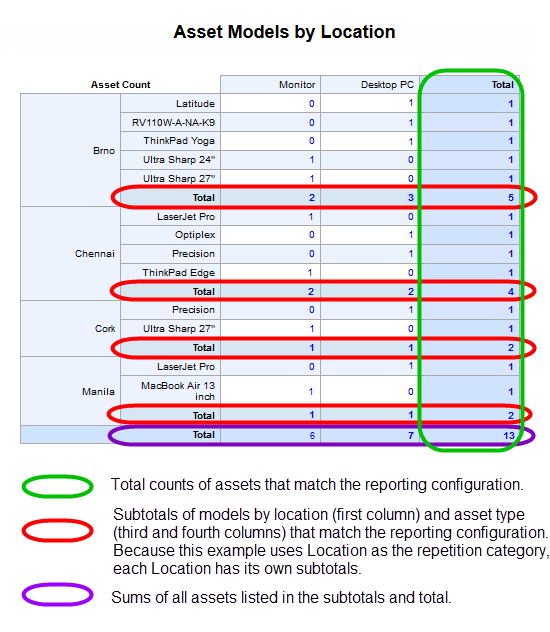
Create a table only asset report
-
In the Chart Type row, select Table Only.

-
Click the Row Category drop-down menu and select the report main category that defines the bars.

- Click the remaining drop-down menu and select the number of items that display in the table.
-
Click the Column Category drop-down menu and select an option. For example, if you select Asset Type, the table columns in the report represent assets by model.

-
Click the Repetition Category drop-down menu and select a category used to create multiple charts. For example, if Repetition Category is set to Location, a separate chart (along with a table, if specified) generates for each location.
-
Select the Table Data attribute that is included in the table displayed below the chart.

- Select the Order By Table Data checkbox to order the categories by table data. Otherwise, leave the checkbox unchecked.
-
Select the targeted values for this report.
-
Select the Show Filters checkbox to include the list of configured filters for this report. Otherwise, clear this checkbox.
-
Select the Show Non-Zero Items Only checkbox to include only data with asset numbers different than zero. Otherwise, clear this checkbox.
- (Optional) Add a report filter.
- Click the Report Filters tab.
- Click New.
Click the Filter Attribute drop-down menu and select an option.
For example, if you select Model, the report filters all assets by model.
If your filter attribute is identical to the report category, only the values allowed by the filter appear in the report.
- Click the Report Details tab.
-
In the Report Details window, click Save.
Your changes are saved.
- Click Run Report.
The report appears, as shown below.
Export the asset data to a consolidated report
-
In the toolbar, click Assets.
-
Click the Search Assets tab.
-
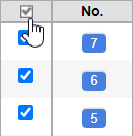
In the checkbox column, select the checkbox at the top of the column.
-
Click a report format.
-
Save the report to your hard drive or another location.