Explore your VMAN environment
After you've added a virtual device to monitor, you'll find all VM data in a set of dashboards in the Orion Web Console. Navigate to MY DASHBOARDS > VIRTUALIZATION to find all of the VMAN-related dashboards: Virtualization Summary, VMware, Hyper-V, Nutanix, Recommendations, Capacity Planning, VMware Events, Storage, Sprawl, and Reporting.
You can get to any SolarWinds Platform product's dashboard by navigating to MY DASHBOARDS at the top of any view in the Orion Web Console.
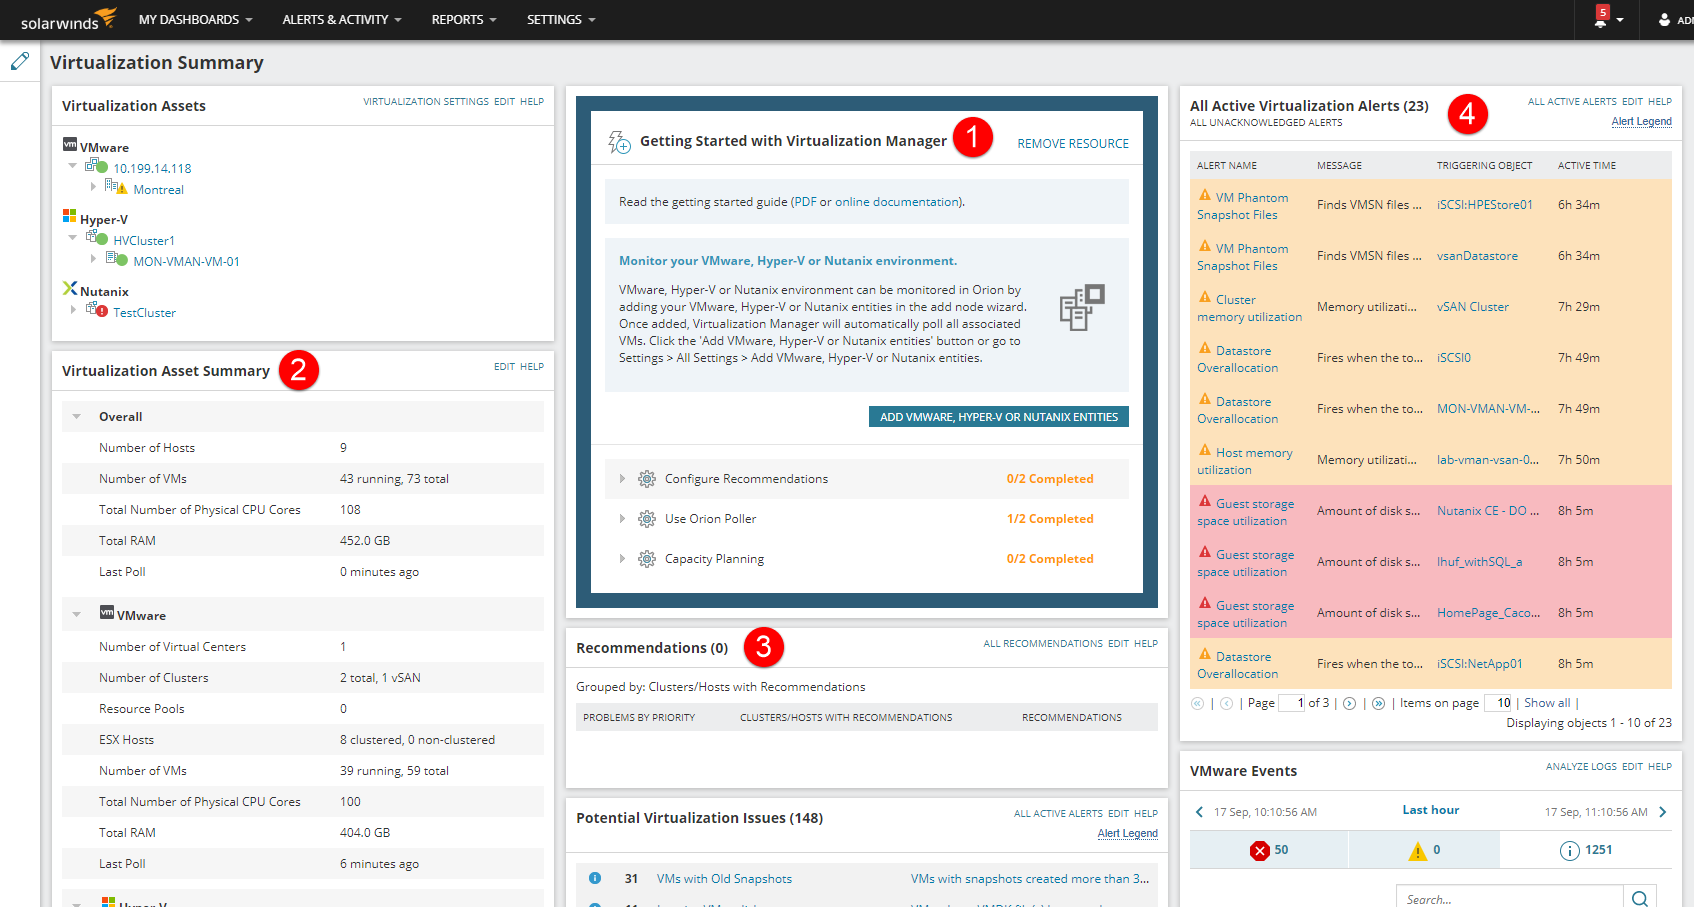
About the Virtualization Summary dashboard
The Virtualization Summary dashboard provides a high-level view of your VMAN environment. From this dashboard, you can review monitored VMs, manage resources, and respond to recommendations and alerts. You can also customize the dashboard to suit your needs.

|
Getting Started resource | Provides immediate options to integrate and configure recommendations. You can remove this resource anytime after getting started to reuse the space. |

|
Virtualization Assets and Asset Summary | Expand to select VMs within your environment. The virtual environment includes virtual centers (VMware), clusters, hosts, datastores, networks, and VMs. The Asset Summary provides an overall breakdown information of VMs per VMware, Hyper-V, and Nutanix. |

|
Recommendations resource | Lists all active and predictive recommendations listed per VM host or cluster. Select the recommendations link to troubleshoot all recommendations. |

|
All Active Virtualization Alerts resource | Lists all active alerts triggered per VM with a detailed message and triggering resource. Select alerts to review details and troubleshoot the issue. |
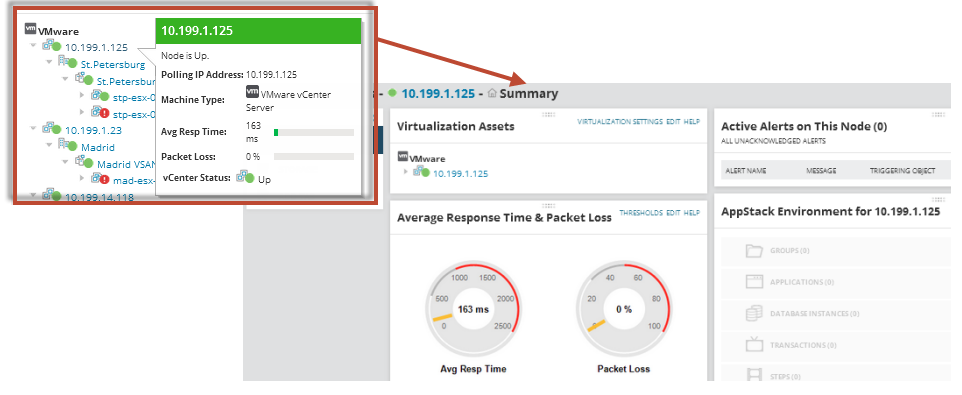
Expand Virtualization Assets to drill-down into your VM environment
Select a VM to open a details page and view the VM status, resources, alerts, recommendations, and related management tools. For example, the VMware virtual center details page includes an expandable virtualization assets view, an AppStack view, alerts, and supported management tools.
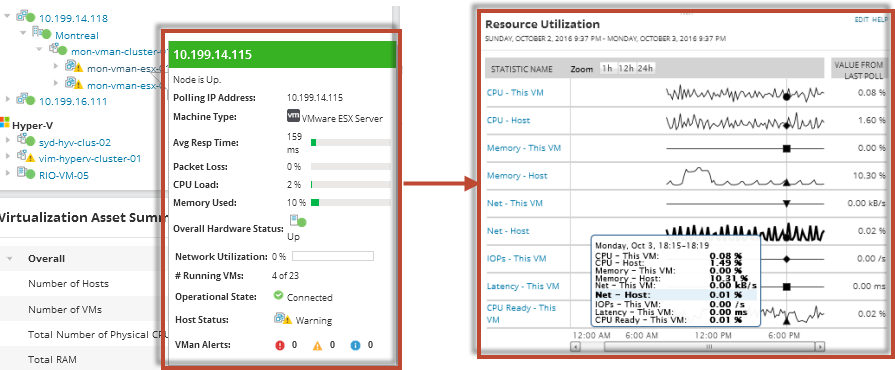
The following graphic displays a VM within a host. The VM details page provides resource use data. Use the Resource Utilization resource to view data gathered for your VMs. Move your cursor across the line graphs to display a tooltip with percentage information for CPU, memory, network usage, IOPs, and latency.