Rogue devices and setting up a White List of allowed devices
You could monitor every device on your network, but in most cases this is not necessary. There are usually devices that are never moved, and can be regarded as safe. UDT lets you create a list of these devices, referred to as the White List. Any device that connects to your network that is not on this list will appear in the Rogue Device widget, and will trigger the appropriate alert.
To set up the white list, add rules that identify the devices to be included. You can identify individual devices by hostname, IP address, or MAC address. You can identify groups of devices using subnets, address ranges, or pattern matching.
By default, UDT is set up with three rules that add all devices to the White List, meaning that there are no rogue devices.
If a White List has not been set up and the three default rules are in place, the Rogue Devices widget looks like this:
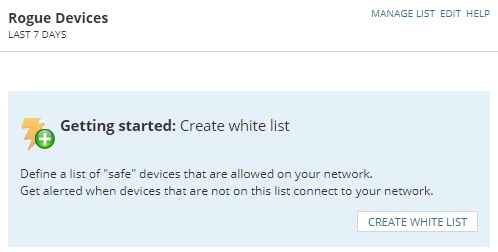
The three default rules are:
- Any hostname is safe
- Any IP address is safe
- Any MAC address is safe
IP addresses or MAC addresses?
A MAC (Machine Access Control) address is given to a network adapter when it is manufactured; it is unique, and cannot be altered.
An IP (Internet Protocol) addresses not usually assigned to a computer, or other device, until it is added to a network. If it is taken away from the network, and then returned, it will receive whatever IP address is available, unless an IP address is reserved. This can be done using SolarWinds IP Address Manager.
These rules use pattern matching. The pattern used for each is the wildcard character, *, which means any hostname, IP or MAC address encountered is added to the White List.
To set up your own White List:
- Go to the My Dashboard > Device Tracker > Device Tracker Summary dashboard.
- On the Rogue Devices widget, click Create White List.
- Choose the selection method for your first rule. You can:
- Select Device, and add individual Hostnames, IP Addresses or MAC Addresses.
- Select IP Range, and add the start and end IP addresses of one or more ranges.
- Select MAC range, and add the start and end MAC addresses of one or more ranges.
- Select Subnets, and add the Subnet Address and Subnet Mask for each subnet.
- Select Custom, and enter the required pattern or patterns, refering to the examples displayed.
- Click Next.
The devices that this rule regards as safe is listed.
- Enter a name, and optional description for this rule, and click Next.
- Click Add New to add another rule.
- When you have set up your rules, delete or disable the three default rules.
- Go to My Dashboards > Device Tracker > Device Tracker Summary. The Rogue Devices widget now shows any devices connected to the network that do not meet the rules you created.
For more on setting up your white list, see the Whitelisting FAQ.
What to do about rogue devices
When a device appears on the rogue device list, it is up to you to decide if it is legitimate or if it needs to be investigated.
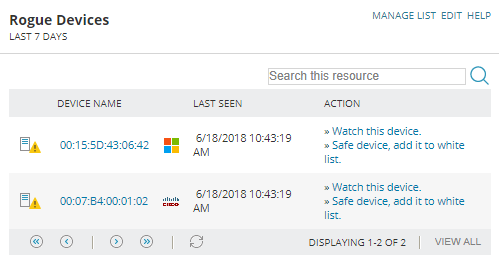
In the first instance above, we see that a Windows device with a MAC address of 00:15:5D:43:06:42 has been added to the network.
The device name column may show the IP address, the MAC address or the DNS address.
If you can tell from this information that it is safe to ignore the device:
- Click Safe device, add it to white list.
The Add devices to the white list page is opened for this device.
- Click Next. On this screen you can enter a name and an optional description for this device.
- Click Finish.
If you want more information before deciding:
- Click the device name.
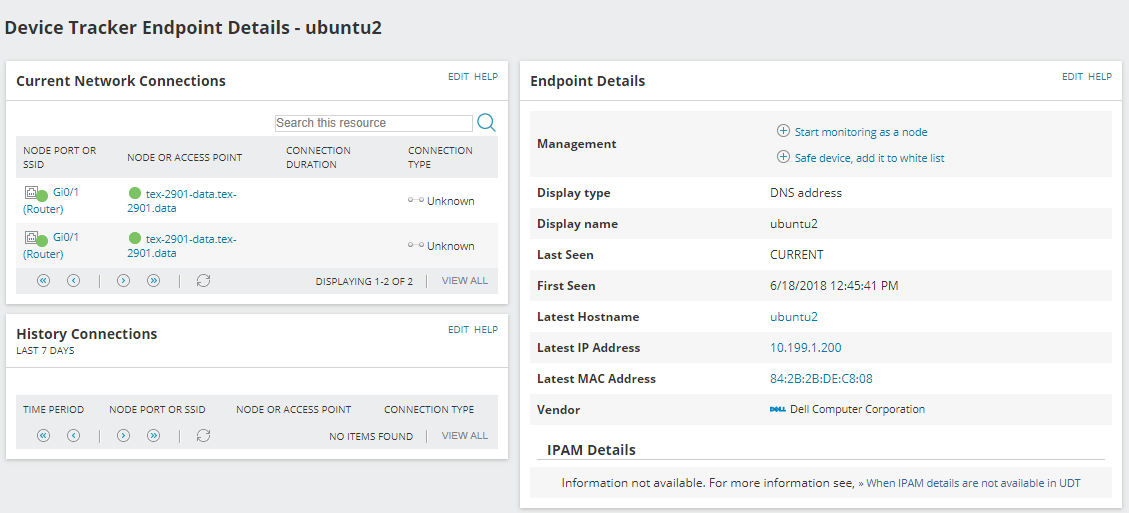
The Device Tracker Endpoint Details page is displayed. Here you can see network connection details, the Hostname, IP address, Mac Address, Vendor and other information for the endpoint.
- To monitor this endpoint as a node, click Start monitoring as a node. This opens the Add Node page.
For further information, see Add a single node for monitoring.
If you want to put this device on the watch list:
- Copy the MAC Address.
- Go to the Device Tracker Summary dashboard.
- Click Manage List on the Device Watch List widget.
- Click Add Device/User.
- Paste or enter the MAC address into the MAC Address field, enter a name and description for this device, and click OK.
If you want further information on the port to which the device is connected:
- On the Endpoint Details page, click Node Port or SSID.
The Port Details page is displayed showing port details and history.
- If you have read/write credentials for the node on which this port is located, you can shut the port down by clicking Shutdown.