Use the Performance Analysis dashboard to investigate a performance issue
In this example you investigate an issue in an environment with SRM and SAM, where an SQL server occasionally goes into critical status.
Use the following metrics from SRM and SAM:
- Availability: to see when the SQL server goes into a critical state.
- Average CPU Load and Average Percent Memory Used: to see if system-wide resources are becoming overloaded and causing this issue.
- I/O Latency Total: to see if high latency on the storage device impacted the SQL server.
- Click My Dashboard > Home > Performance Availability.
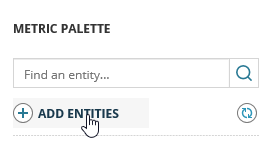
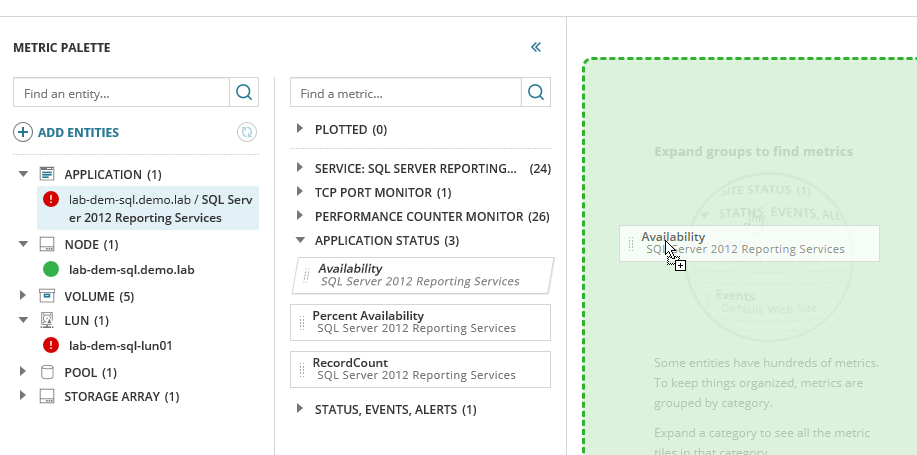
- On the Metric Palette, click Add Entities.
- Select Type to filter the available entities and select Application.
- From the list of applications, select an application. This example selects SQL Server 2012 Reporting Services.
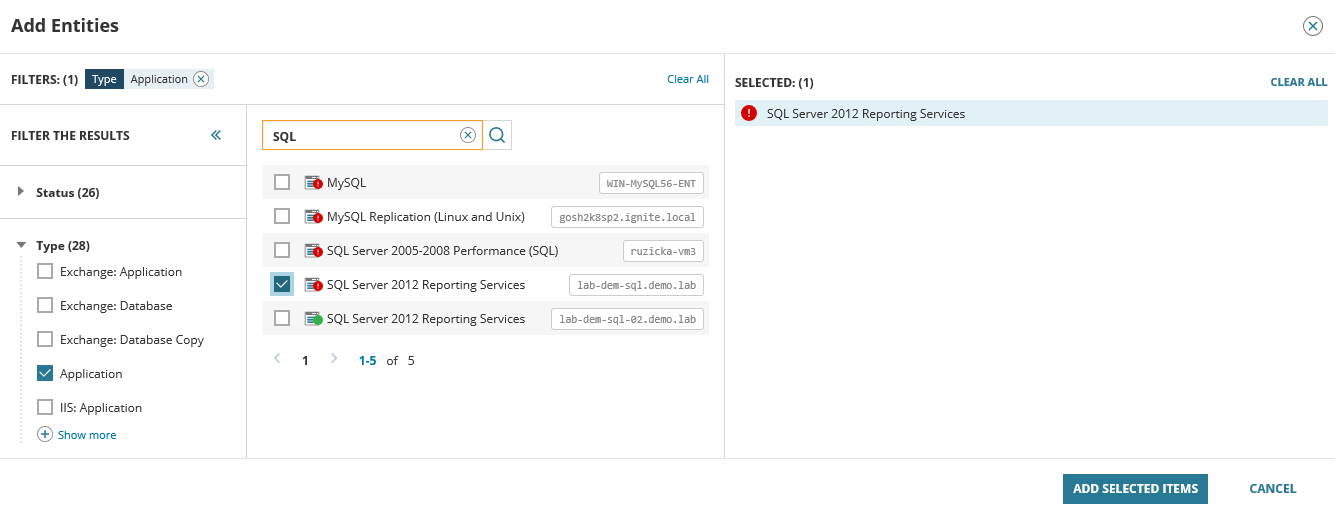
- Click Add Selected Items.
- The Metric Palette now contains an Application group. Expand this and click the
 icon after the application name. This adds all related entities.
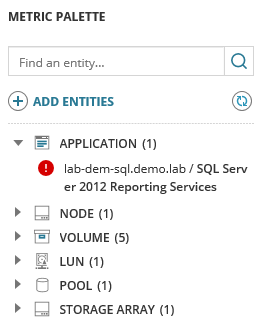
- Expand the Node and LUN entities.
- Click the application name. The metric groups associated with this entity are shown in the next column.
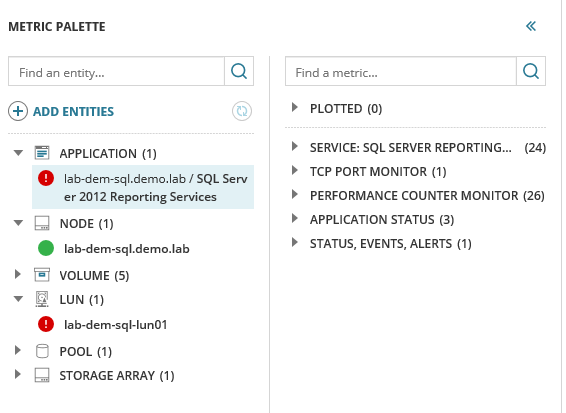
- Expand the metric groups to display the metrics.
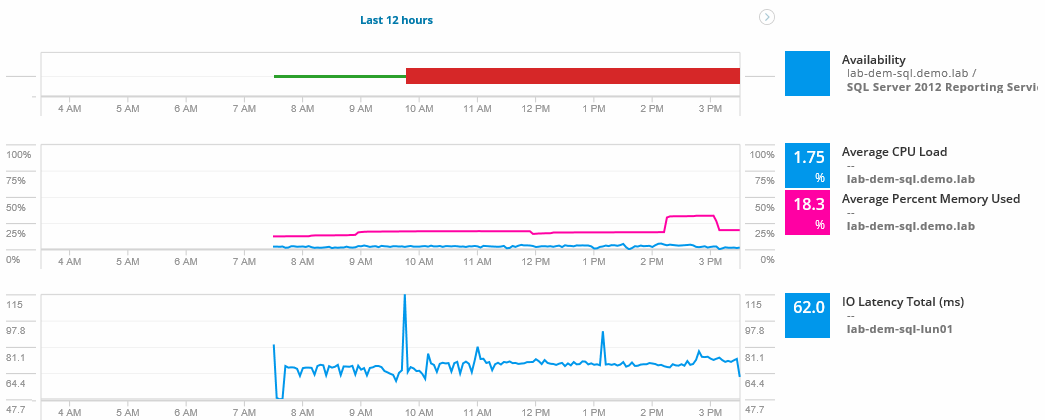
- Drag the Availability metric into the right side of the view. A chart showing Availability for the last 12 hours is displayed.
- Repeat steps 8 to 10 to add the node and LUN metrics.
- You can drop node metrics into the same chart to save space.
You now have a dashboard that shows specific SRM and SAM data for the last 12 hours.
You can easily see that while Average CPU Load and Average Percentage Memory Used remained stable, the LUN showed high latency at the moment the SQL server became unavailable. This suggests that you should move the database from this LUN to a faster LUN.
Click Save to save this dashboard. Any dashboard can be shared by its creator. It can then be used as-is or form the basis for future investigation.