SEM Dashboard
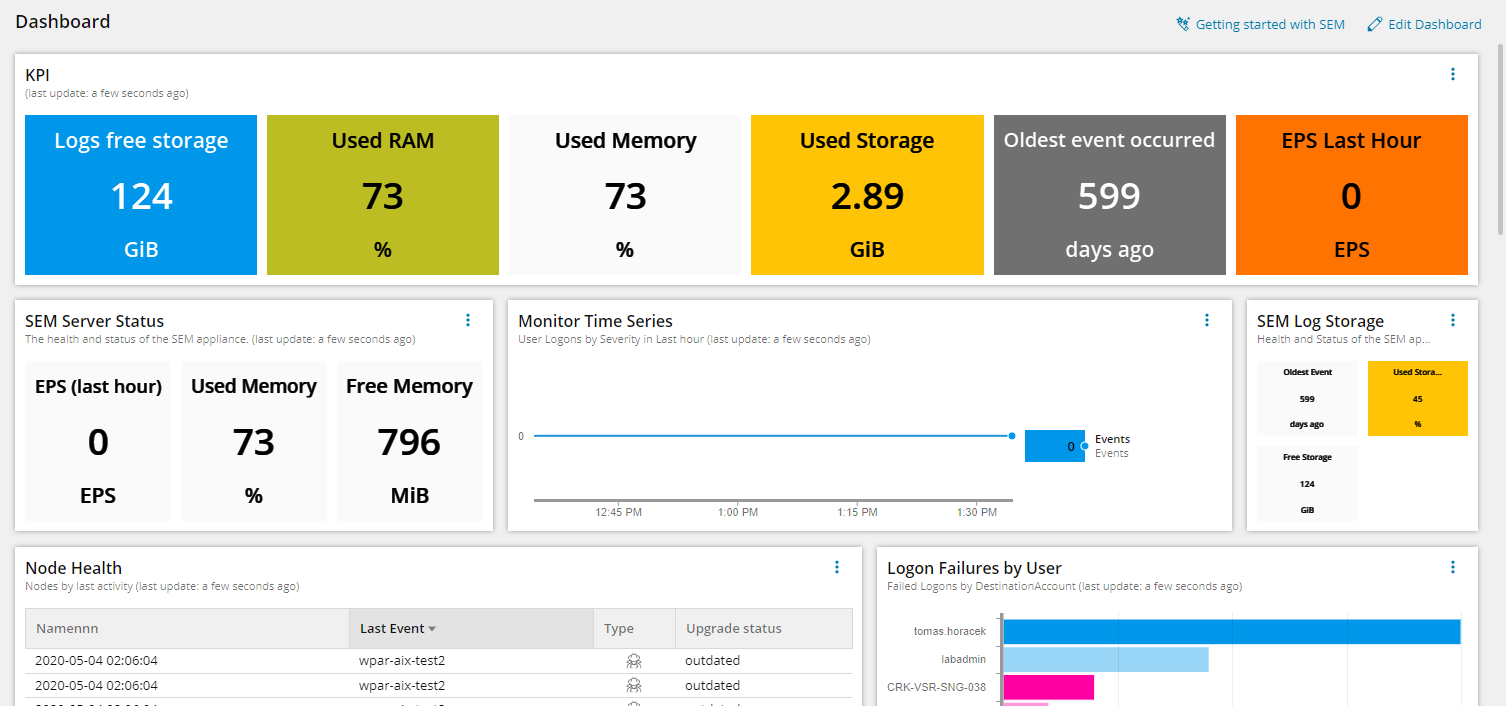
The SEM Dashboard allows you to visualize the network and log data in your corporate environment. Using the dashboard, you can highlight and summarize trends and suspicious activity through a series of interactive widgets. You can also create, edit, and arrange widgets to display log data in a variety of tables and graphs based on filters within your Events viewer.
Although SEM provides a library of widgets, you can create your own by using filters that you customized to monitor specific activity. If your widget includes charts, you can click a specific line, bar, or pie wedge to open the source filter. The corresponding filter opens the Events viewer, and displays the targeted filter information. The filter lists only the events that correspond with the selected chart item.
To access the SEM Dashboard, click the Dashboard tab on the console toolbar.
Click an event or data point in a widget to view associated details in the Events viewer.
Clicking the Others grouping in select widgets will show all events associated with that widget.
The following table lists the widgets you create, edit, and customize in the application.
| Widget Type | Description |
|---|---|
| KPI | Displays metrics about the health and performance of the SEM appliance. |
| Proportional | Displays an overview of widget group sizes in assorted charts (donut chart, pie chart, horizontal bar chart, vertical bar chart). |
| New Time Series - Long Term | Displays event data for up to the last seven days. This data includes a broad range of records with less granularity than short-term widgets. |
| New Time Series - Short Term | Displays more granularity by allowing you to select filter and property data for a specified number of groups. For example, you can display a timeline chart of failed log-ons for the designated groups. |
| New Nodes Table Widget | Displays a variety of properties for each node in your network, such as IP address, operating system, connector profile, status, and more. |
If you created custom widgets with the old Flash console, these are not automatically migrated to the current SEM Dashboard, and you will need to recreate them.
See the following topics for more information.