-

Administrator Guide
-
Collect Logs
-
Collect Logs: Apps & Services
- ESXi
- Routers network hardware
- Apple iOS and macOS
- Unix and BSD system logs
- C# and .NET (NLog)
- C# and .NET (log4net)
- Java logback
- Android
- Kubernetes cluster logging with rKubelog
- haproxy
- Advanced Unix logging tips
- Perl
- Windows
- Kubernetes
- Erlang
- Node.js
- Java log4j
- JavaScript
- Unicorn
- PHP
- Docker
- systemd
- Ruby on Rails
- MySQL
- Unix and BSD text log files (remote_syslog2)
- Redis
- Go
- Python
- Elixir
- IIS
- Embedded devices or proprietary systems
-
Collect Logs: Hosting Services
-
Collect Logs: Integrations
-
Manage Logs
- Groups
- Log flood detection
- Web Hooks
- Log colorization
- Linking to logs
- JSON search syntax
- Settings API
- Log destinations
- Alerts
- Command-line client
- Log filtering
- HTTP API
- Automatic S3 archive export
- Managing Senders
- Permanent log archives
- Mapping senders to groups
- Search syntax
- Click-to-search
- Log search API
- Event Viewer
-
Send Logs for Analytics
-
SolarWinds Users & Orgs
-
Support and Security
-
What's New
AppOptics
Introduction
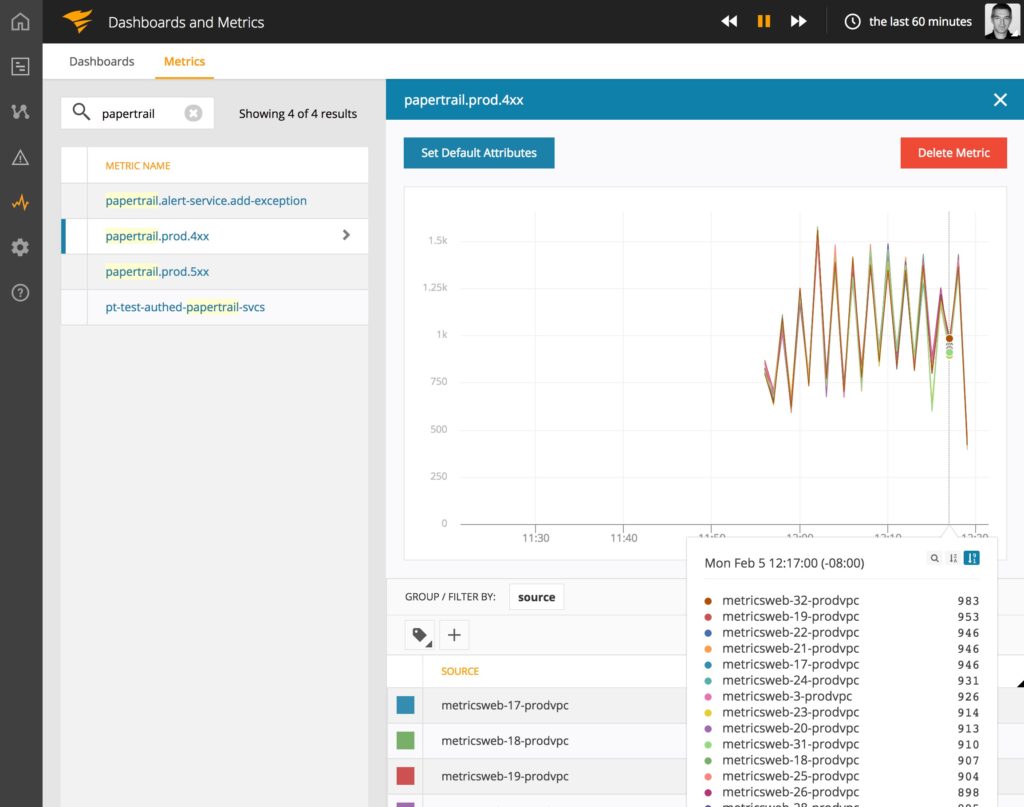
Papertrail can create and update an AppOptics graph displaying the number of log messages matching a search alert.
Setup
Follow the steps in Alerts.
Settings
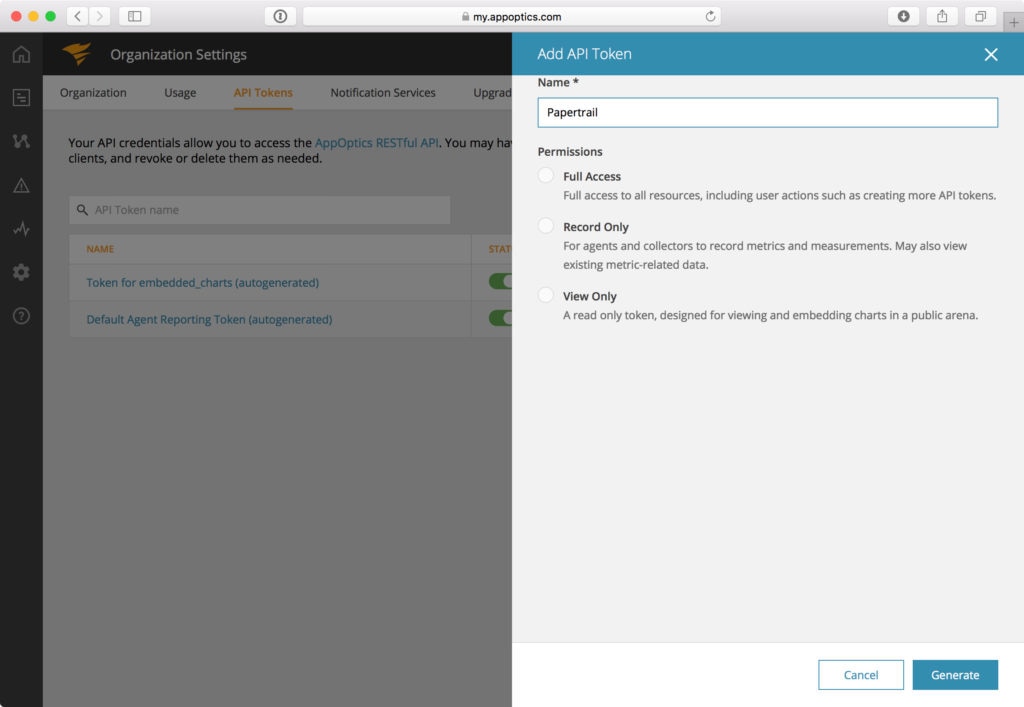
From AppOptics’ Settings page, under the API Tokens tab, generate a new Record Only API token for Papertrail.
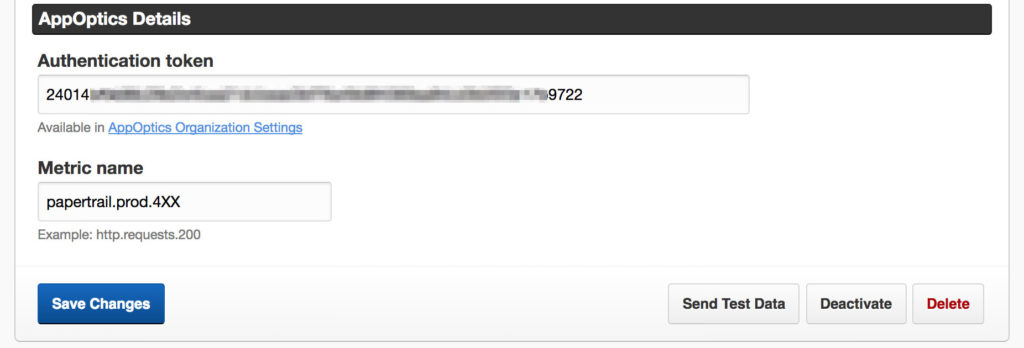
For the search alert you are creating, choose:
- Metric name, such as
Exploit attemptsorsystems.http.500.
The metric name must be URI-safe. Only alphanumeric characters, periods, hyphens, underscores, or colons are allowed.
Your alert details should look something like this:
Metric Attributes
The new metric will only appear in AppOptics after the alert has triggered. After it has started reporting, simply click on the metric name to see the chart.