General threshold types in the SolarWinds Platform
This SolarWinds Platform topic applies only to the following products:
Hybrid Cloud Observability Essentials — Hybrid Cloud Observability Advanced
DPAIM — NAM — NCM — NPM — NTA — SAM — SRM — VMAN — VNQM — WPM
Use these settings to:
- Specify devices to be included in reports that identify devices with high values for a specific metric, such as High CPU load, High Disk Usage, ...
- Highlight values for devices that exceed the threshold for a specific metric in Top X widgets, such as Top X Devices by Packet Loss. See an example.
- Highlight values that exceed thresholds for specific metrics in gauges. See an example.
Starting with Orion Platform 2019.2, you can include thresholds in calculating the node status.
Avg CPU Load
Define when the CPU load on devices is critical and what value you want to be warned about.
Devices with CPU load higher than the Warning Level are included in High CPU Load reports.
Specify how you want the SolarWinds Platform to calculate whether your environment is exhausting its resources based on this metric. You can choose to calculate exhaustion using average daily values or peak daily values.
Critical Level
When the values of CPU load on a device exceeds the Critical Level, the value for this metric and the metric names are displayed as bold red in Top X widgets and in gauges.
Warning Level
When the value of CPU load on a device is higher than the Warning Level, values for this metric and the metric name are displayed as red in Top x widgets and in gauges.
Disk Usage
Define the amount of used storage space that is critical (in percent) and the amount of used storage space you want to be warned about.
Devices with disk usage higher than the Warning Level are included in High Disk Usage reports.
Specify how you want the SolarWinds Platform to calculate whether your environment is exhausting its resources based on this metric. You can choose to calculate exhaustion using average daily values or peak daily values.
Critical Level
When the disk usage value on a device is higher than the Critical Level, the value and the metric name are displayed in bold red in Top X widgets and in gauges.
Warning Level
When the disk usage value on a device is higher than the value set for the Warning Level, but lower than the value set for the Critical Level, the metric name and values are displayed in red in Top X widgets and in gauges.
Percent Memory Used
Define when the percentage of used memory on devices is critical and what value you want to be warned about.
Devices with Percent Memory Used higher than the Warning Level are included in Percent Memory Used reports.
Specify how you want the SolarWinds Platform to calculate whether your environment is exhausting its resources based on this metric. You can choose to calculate exhaustion using average daily values or peak daily values.
Critical Level
When the percent memory used on a device is higher than the value set for the Critical Level, the metric name and values are displayed as bold red in Top X widgets and in gauges.
Warning Level
When a percent memory usage value on a device is higher than the value set for the Warning Level, but lower than the value set for the Critical Level, the metric name and values are displayed as red in Top X widgets and in gauges.
Percent Packet Loss
Define when the Percent Packet Loss on devices is critical and at what value you want to be warned about.
Devices with Percent Packet Loss higher than the Warning Level are included in High Percent Loss reports.
Critical Level
When the percent packet loss on a device is higher than the value set for the Critical Level, the metric name and values are display as bold red in Top x widgets and in gauges.
Warning Level
When the percent packet loss on a device is higher than the value set for the Warning Level, but lower than the value set for the Critical Level, the metric name and values are displayed as red in Top X widgets and in gauges.
SolarWinds Platform products calculate percent packet loss using ICMP ping requests made on the Default Poll Interval. The poller sends a ping to monitored devices and records the results of the ten most recent ping attempts. Percent packet loss is expressed as the number of failed ping requests, X, divided by the number of ping requests, 10.
For example, if, at a given point in time, the last ten ping requests made of a selected device resulted in 2 failures and 8 successes, the percent packet loss for the selected device at the given time is reported as 2/10, or 20%.
Response Time
Define when the response time on devices is critical and what value you want to be warned about.
Devices with response time higher than the Warning Level are included in High Response Time reports.
Critical Level
When the response time value on a device is higher than the value set for the Critical Level display, the metric name and values are displayed as bold red in Top X widgets and in gauges.
Warning Level
When the response time value on a device is higher than the value set for the Warning Level, but shorter than the value set for the Critical Level, the metric name and values are displayed as red in Top x widgets and in gauges.
SolarWinds Platform products calculate response time using ICMP ping requests made on the Default Node Poll Interval. The poller sends a ping to monitored devices and records the results of the ten most recent ping attempts. Average Response Time is expressed as the average response time of these last 10 ping requests. If the poller does not receive a ping response within the Default Poll Interval, it will attempt to ping the non-responsive device once every 10 seconds for the period designated as the Warning Interval.
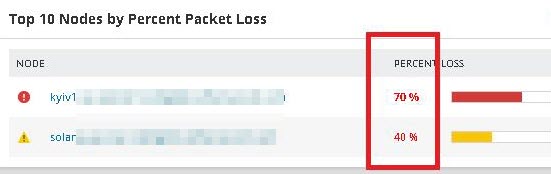
Example: Warning and Critical threshold exceeded in a Top X widget
In this widget, the packet loss of the first node (kyiv..) has exceeded the critical threshold (that's why the percentage is bold red). The whole node has the critical status, so the node has the critical icon and the progress bar is red.
The packet loss for the second node (solar...) has exceeded the warning threshold, so the percentage is red. The whole node is in the warning status, that's why there's the warning icon and the progress bar is yellow.
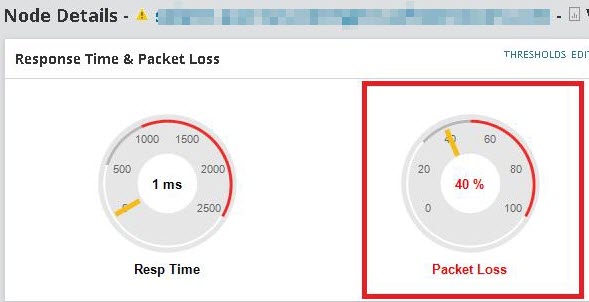
Example: Warning threshold exceeded in a gauge
This widget displays two gauges: Response Time and Packet Loss. Packet loss on the node has exceeded the warning threshold, that's why the metric name and the current percentage are both red.