Create a DPA report to track wait types for a single SQL statement
Use DPA reports to identify database trends and track the results of your performance tuning.
The following example creates a report to track wait types for a specific SQL statement. If you made changes to reduce a specific type of wait for a SQL statement, you can use this report to determine if your tuning efforts were effective.
For general information about creating DPA reports, see Create a DPA report.
- On the DPA menu, click Reports.
-
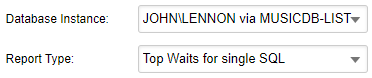
Select the database instance and the report type.
For this example, choose Top Waits for single SQL.
-
Click Search and locate the SQL statement.
If you named the statement, enter part of the name and make sure Name and Hash is selected. Then click Search.
The Search Results lists all SQL statements run against the selected database instance that match your criteria.
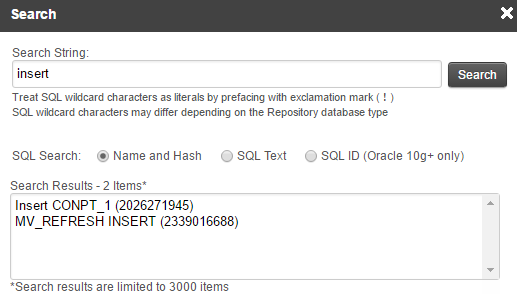
- Select the SQL statement, and click OK.
-
Click Report Options.
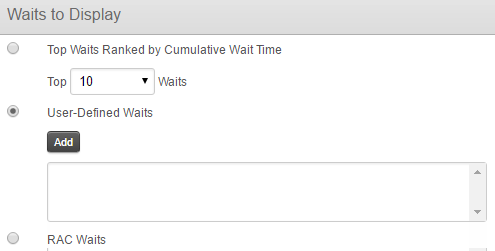
This report can show the top waits, or it can show specific wait types (regardless of their wait times).
-
For this example, complete the following steps to specify
db_file_scattered readwaits andMemory/CPUwaits.-
Under Waits to Display, select User-Defined Waits and click Add.
-
Enter part of the wait name (for example,
scattered), and click Search.The Search Results section lists all waits that match your search criteria.
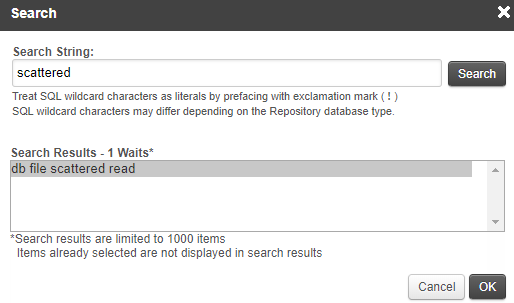
- Select
db file scattered read, and click OK. -
Repeat the previous steps to add
Memory/CPUwaits, and click OK.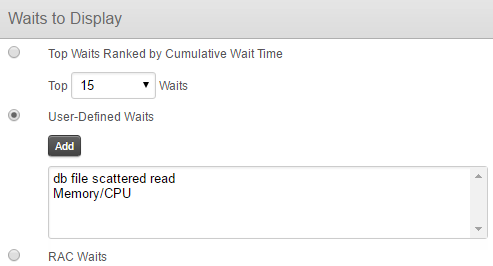
-
-
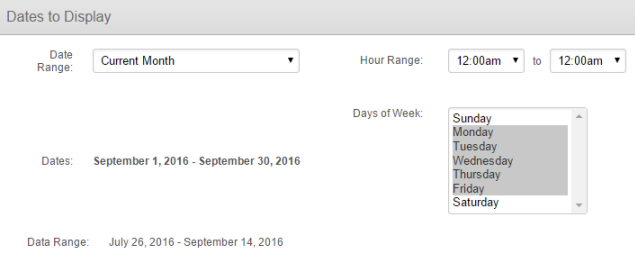
Under Dates to Display, specify the dates that the report should include.
In this example, the date range is the current month, and the report includes only weekdays.
The Data Range at the bottom of this section shows the time period for which data is available.
-
Under General, complete the following fields.
Report Name Enter a unique name to identify this report in the report list. Report Title (Optional) Enter a title to display at the top of the report. If you leave this field blank, the report title defaults to the report type, database instance, and time period. Report Description (Optional) Enter a description to explain the report's content or purpose. 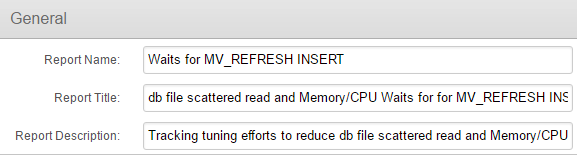
-
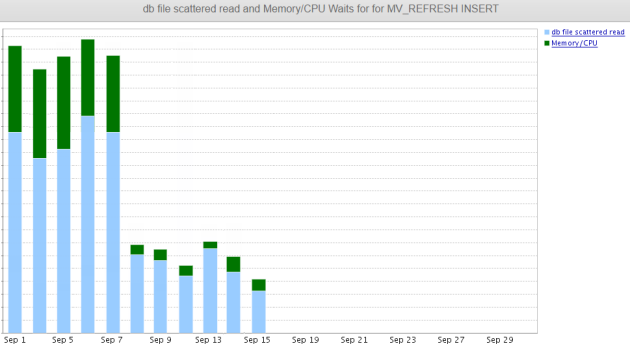
In the New Report section at the top of the window, click Display Report.
The report opens. In this example, the drop in wait times after September 7 shows that the tuning efforts were effective.
- Click Save and then OK to save the report.
-
To return to the list of reports, click Reports in the breadcrumb navigation at the top of the window.

You can view the report from the Reports tab at any time, or schedule the report to run automatically and be emailed to a group of recipients.