View information from remote servers on the DPA Central Server
In a DPA Central Server, the Central page displays summarized information about all connected DPA servers.
Open the Central page
The default home page of a Central Server is the DPA home page. Open the Central page to see database information from all connected DPA servers.
- Log in to your DPA Central Server as an administrator.
- From the DPA menu in the upper-right corner, click Central.
View the number of alarms for each server
On the Central page, click the Alarm Summary tab to see a summary of how many critical or warning level alerts or alarms are reported by each DPA server. The number on each row represents the number of issues reported for all instances monitored by that DPA server.
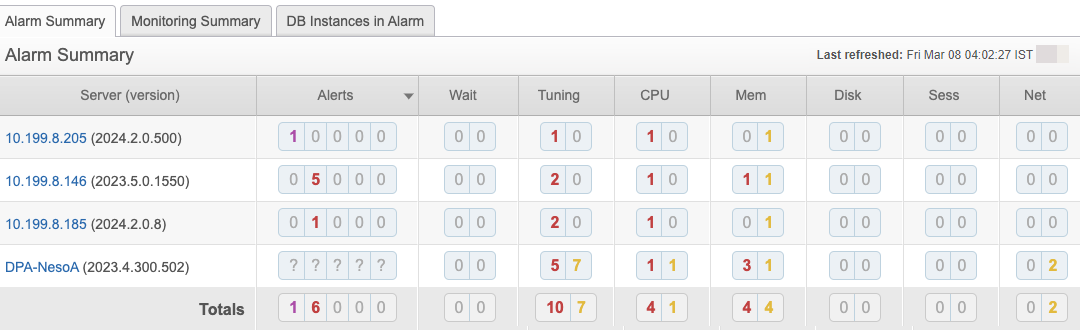
The Alarm Summary displays the following information:
-
Alerts: The number of broken alerts, and the number of alerts at each level that are triggered but not acknowledged. When the table is sorted by the Alerts column in descending order, broken alerts have the highest severity, followed by high-level alerts, followed by each subsequent alert level.
Alert information is available in DPA 2024.2 and later. For DPA servers running earlier versions, a question mark is displayed. Upgrade your DPA servers to 2024.2 or later to see alert information for all servers.
-
Wait: The number of database instances where the wait time during the last hour was higher or much higher than normal.
-
Tuning: The number of query, index, or table tuning advisors with a warning or critical status.
-
CPU: The number of CPU metrics whose value exceeded the warning or critical threshold.
-
Mem: The number of memory metrics whose value exceeded the warning or critical threshold.
-
Disk: The number of disk metrics whose value exceeded the warning or critical threshold.
-
Sess: The number of session metrics whose value exceeded the warning or critical threshold.
-
Net: The number of network metrics whose value exceeded the warning or critical threshold.
To see more detailed information, click a DPA server name or IP address in the Server column to open the DPA home page for that server.
View the number of registered databases not being monitored
On the Central page, click the Monitoring Summary tab to see how many instances registered by each DPA server are running. Each column represents a database type. A green up arrow indicates that some or all of the registered instances are running, and a blue down arrow indicates that none of the registered instances are running.

To see more detailed information, click a DPA server host name or IP address in the Server column to open the DPA home page for that server.
View alarm information for each monitored database instance
On the Central page, click the DB Instances in Alarm tab to see which monitored database instances have triggered alerts or alarms. The color of the square or icon indicates severity.
The DB Instances in Alarm tab lists a maximum of 200 database instances. If you are monitoring more than 200 instances, sort by severity to see the instances with the most severe issues.
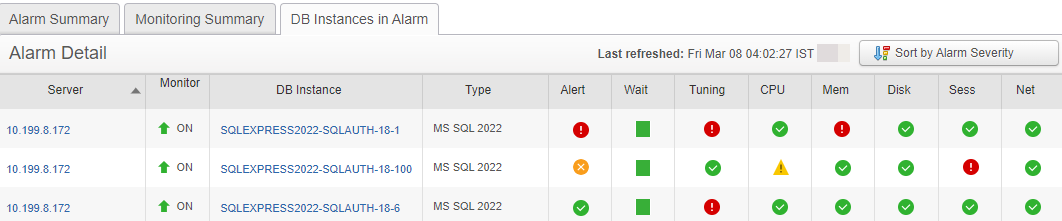
The following columns indicate whether any alerts or alarms were detected for each monitored instance:
-
Alert: If the instance has any broken alerts, this column contains the broken alert icon
 . Otherwise, it contains an icon to indicate the highest severity alert that is triggered but not acknowledged. When the table is sorted by the Alerts column in descending order, rows with broken alerts are first, followed by rows with high alerts, followed by each subsequent alert level.
 Alert information is available in DPA 2024.2 and later. For DPA servers running earlier versions, a question mark is displayed. Upgrade your DPA servers to 2024.2 or later to see the alert status for all monitored instances.
-
Wait: A colored box to indicate whether anomalies (higher than usual waits) were detected for the instance during the last hour.
-
Tuning: An icon to indicate if query, index, or table tuning advisors with a warning or critical status were detected for the instance.
-
CPU: An icon to indicate if the values of CPU metrics exceeded the warning or critical threshold.
-
Mem: An icon to indicate if the values of memory metrics exceeded the warning or critical threshold.
-
Disk: An icon to indicate if the values of disk metrics exceeded the warning or critical threshold.
-
Sess: An icon to indicate if the values of session metrics exceeded the warning or critical threshold.
-
Net: An icon to indicate if the values of network metrics exceeded the warning or critical threshold.
To see more detailed information, click a DPA server name or IP address in the Server column to open the DPA home page for that server. Or click the instance name in the DB Instance column to open the Trends charts for that instance.
Sort by severity
By default, the Alarm Detail table on the DB Instances in Alarm tab is sorted by the DPA server name or IP address. To put the instances with the most severe issues at the top of the list, click Sort by Alarm Severity.
When multiple rows have the same severity score, issues in the Alert column are given more weight, followed by the Wait column, the Tuning column, and then all other columns.
Search for a monitored database instance
From any tab, you can search for a monitored database instance by name.
-
In the Search by DB instance name box, enter a string that is included in the instance name as it is displayed in DPA.
-
To limit the search to one database type, select a type from the drop-down menu.
-
Click Search.
The search results are listed on a separate tab, which opens automatically. It displays the same information about each instance as the DB Instances in Alarm tab.
Change the default refresh rate
When users are viewing the DPA Central page, the displayed data is refreshed every 300 seconds by default. You can change the default refresh rate.
-
From the DPA menu in the upper-right corner, click Options.
-
Under Administration > Display, click Display Options.
The Display Options page opens.
-
In the DPA Central Page Refresh box, enter the number of seconds between DPA Central data refreshes.
Manually refresh cached data
To manually refresh the DPA Central cache and update the displayed data:
-
From the DPA menu in the upper-right corner, click Options.
-
Under Support > Utilities, click Refresh Central Cache.