Monitor WPM transactions in views and widgets
You can display different views of WPM information in the SolarWinds Platform Web Console to access a variety of information about WPM transactions as they are played back within your environment. Each view includes graph, chart, or table widgets pertaining to that view.
See the SolarWinds Platform Administrator Guide to learn about customizing dashboards, views, and widgets to show the data you want in the way most useful to you.
To monitor transactions from within the SolarWinds Platform Web Console, click My Dashboards > Web > Transactions Summary.
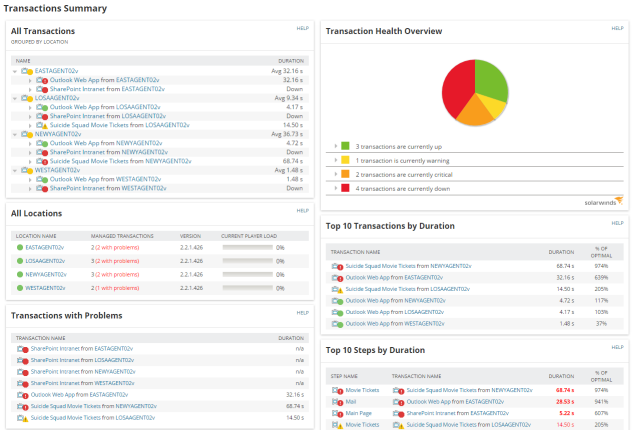
From the Transactions Summary view, you can drill down into the following WPM subviews:
Note the following details about WPM views:
- A dashboard framework in SolarWinds Platform is described in this THWACK post. Modern dashboards replaced the concept of views. You can still access WPM views to customize them; see Customize modern dashboards.
- In each WPM view, you can click the Map icon in the left menu to access SolarWinds Platform Maps, a troubleshooting tool that provides a visual representation of physical and logical relationships between entities.
- Like other SolarWinds Platform views, you can adjust WPM views to show the data you want in the way most useful to you. See the SolarWinds Platform Administrator Guide to learn about customizing dashboards, views, and widgets.
- You can add widgets to views to customize them, as described in the SolarWinds Platform documentation.
Use the Application Stack (AppStack™) view to check the overall health of your WPM environment, and then drill down into applications, transactions, and steps for a closer look. See Use AppStack with WPM for details.