Introduction to the AppStack Environment view
The AppStack Environment view (also called "AppStack") provides you with a powerful layer of troubleshooting visibility by exposing all participating objects in your environment, as well as their relationships to one another. This view is useful in assessing the overall health of your environment, as well as troubleshooting specific and related problems.
To help you better understand how this visualization of your environment can be used for troubleshooting, the following analogy was designed to provide you with a simple, high-level overview of how AppStack processes and displays information.
The AppStack Environment view analogy
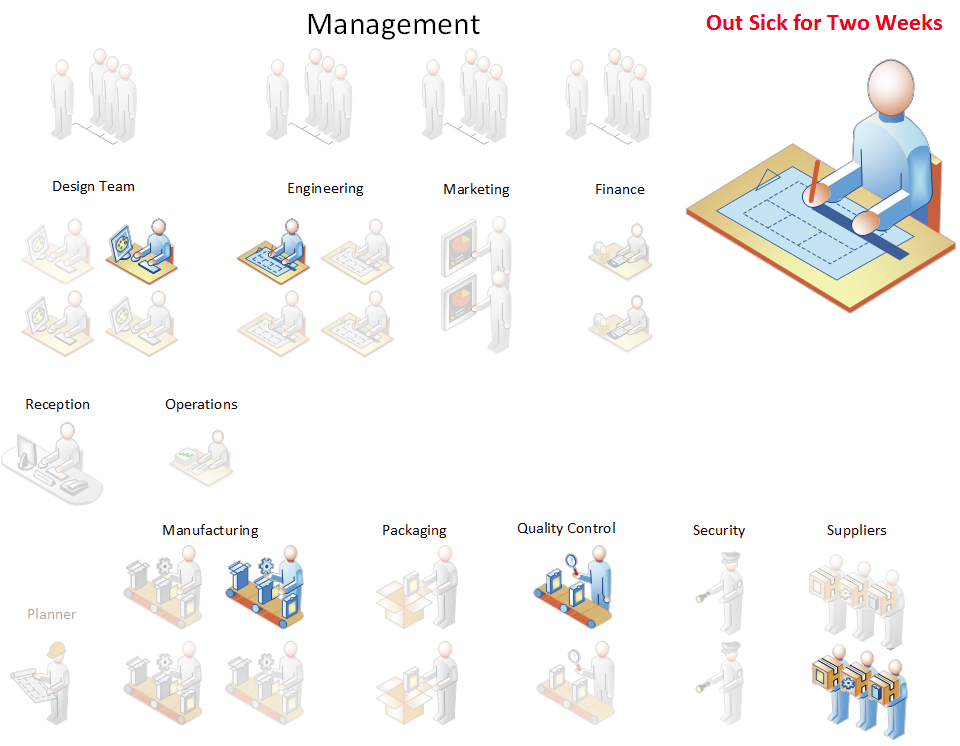
Imagine you work for a company comprised of many employees that work in various departments. In this example, you work in the Engineering department as an engineer:

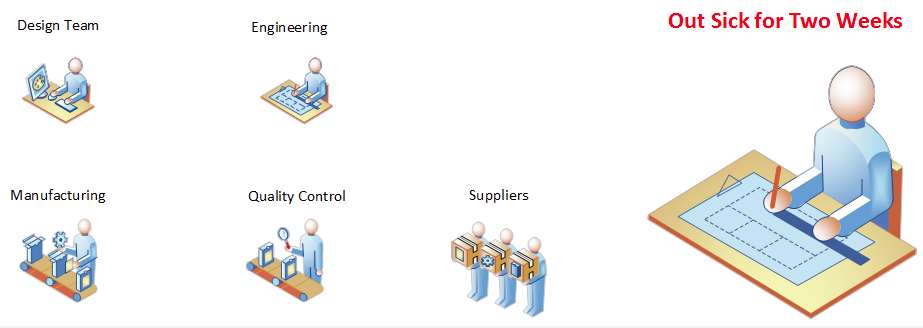
Now imagine you're sick and cannot work for two weeks. Certain employees in various departments are affected by your absence. Others are not be affected. The illustration below highlights the employees who are affected by your absence by fading those who are not affected.
Focusing on only the people who are affected by your absence can be beneficial from a task management perspective. Therefore, completely hiding those not affected by your absence gives a clean and concise view, displaying only the necessary information.
Now, instead of employees, imagine this is about your entire IT environment. The goal of the AppStack Environment view is to help you quickly assess the impact a given object has on its related objects. This relational view is the AppStack Environment view found in the SolarWinds Platform Web Console.
The AppStack Environment view
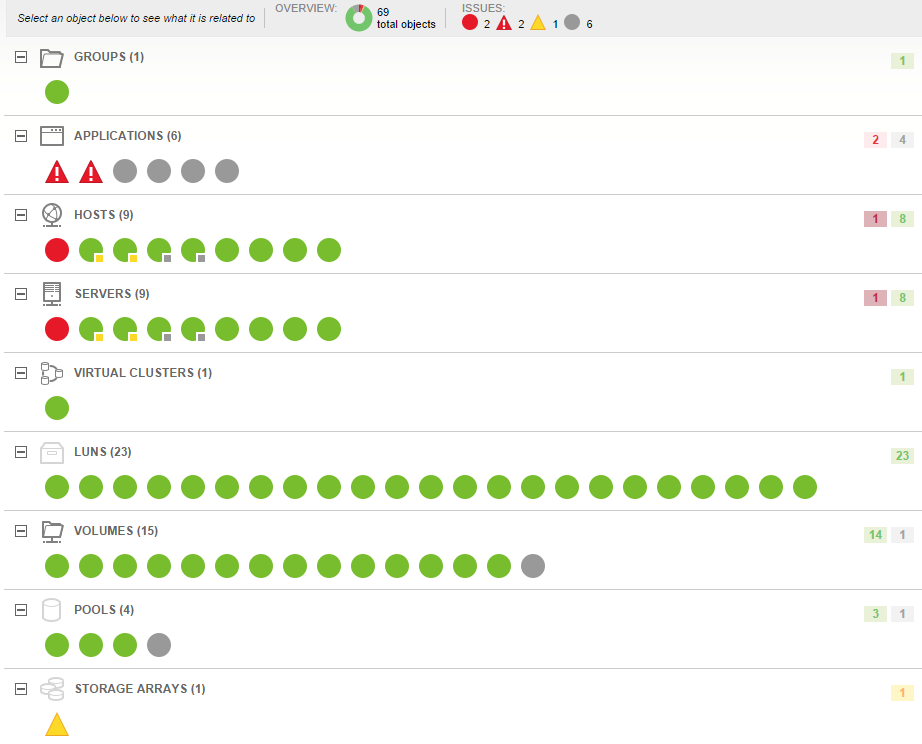
The AppStack Environment view, shown below, displays the status of individual objects in your IT environment through the SolarWinds Platform Web Console. Objects are categorized and ordered from left to right, with the worst status being shown on the left side of the view.
Clicking an object shows everything related to that object by fading unrelated objects, as shown:
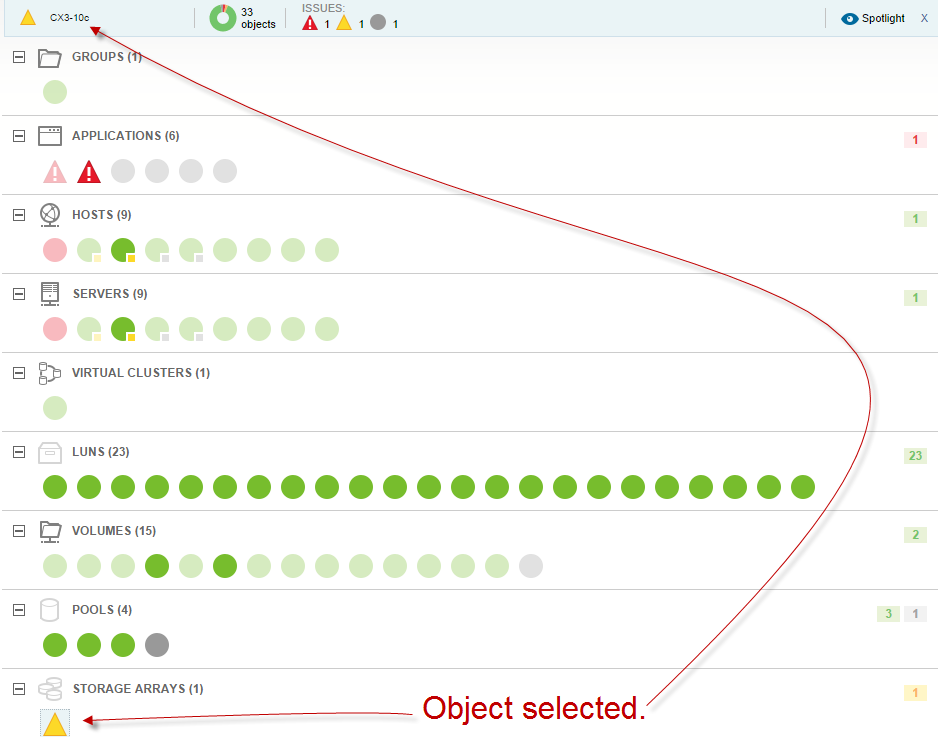
Clicking Spotlight removes the faded, unrelated objects from the view entirely.
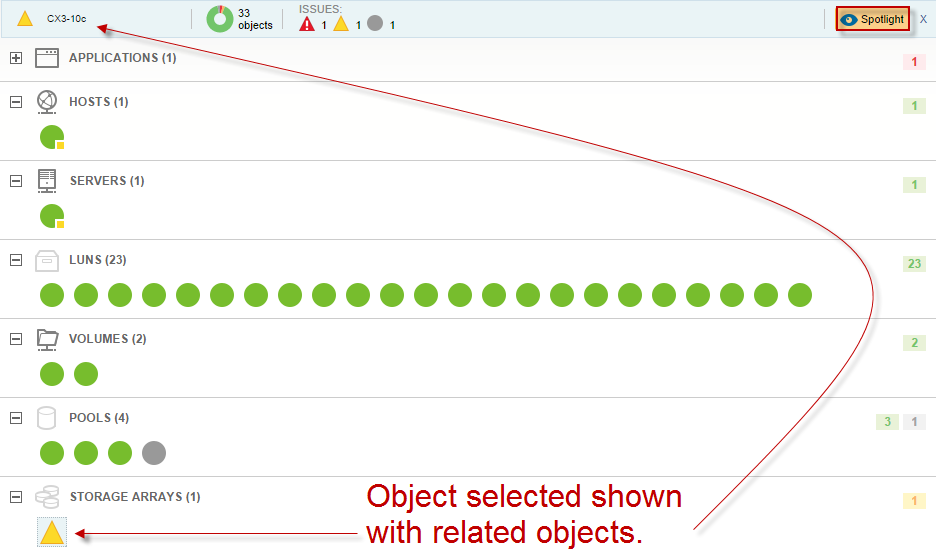
Click the selected object at the top, or double-click it in the view to open the Details view for that object for further investigation.
If your environment includes both SAM and SolarWinds Data Performance Analyzer (DPA), you can use the DPA Integration Module (DPAIM) to visualize DPA data in AppStack. To learn more, see Use the DPA Integration Module with SAM.