Use the AppOptics subview in SAM
For IIS pools on nodes integrated with SolarWinds AppOptics, an extra subview is accessible from the AppInsight for IIS Application Pools Details page. Hover over the left menu and click the Subview icon to display the following default widgets:
- Average Response Time
- HTTP (5xx) Error Rate
- HTTP Methods
- HTTP Status Codes
- Requests per second
Within these widgets, you can:
-
Hover over points on graphs to display specific information.
-
Click the time period hyperlink to select a different range (for example, the Last 12 hours) or configure a specific time and date range. Graphs show data for the last hour, by default.
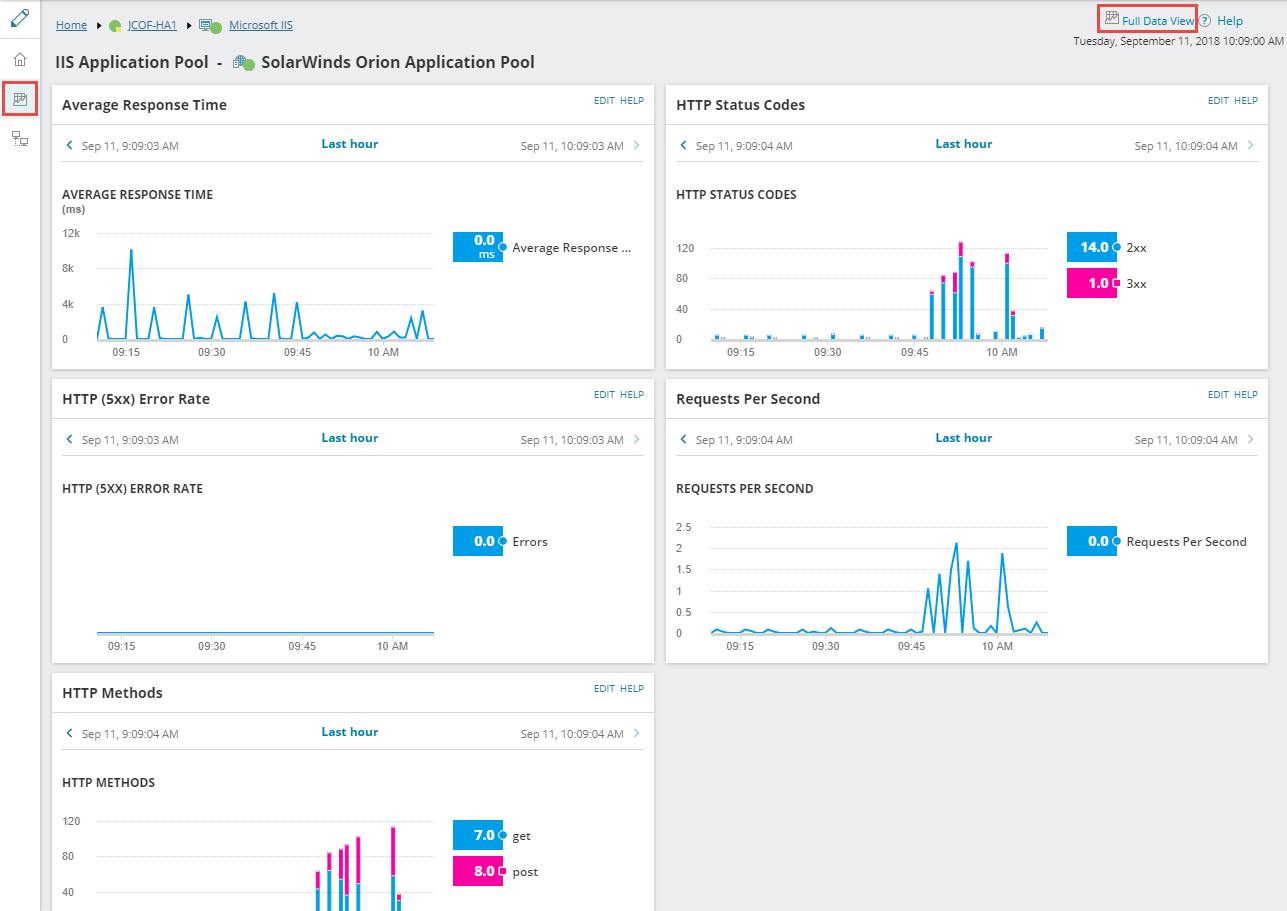
Click Full Data View at the top of the subview to open a browser and log in to SolarWinds AppOptics to display additional data, as shown in the following example:
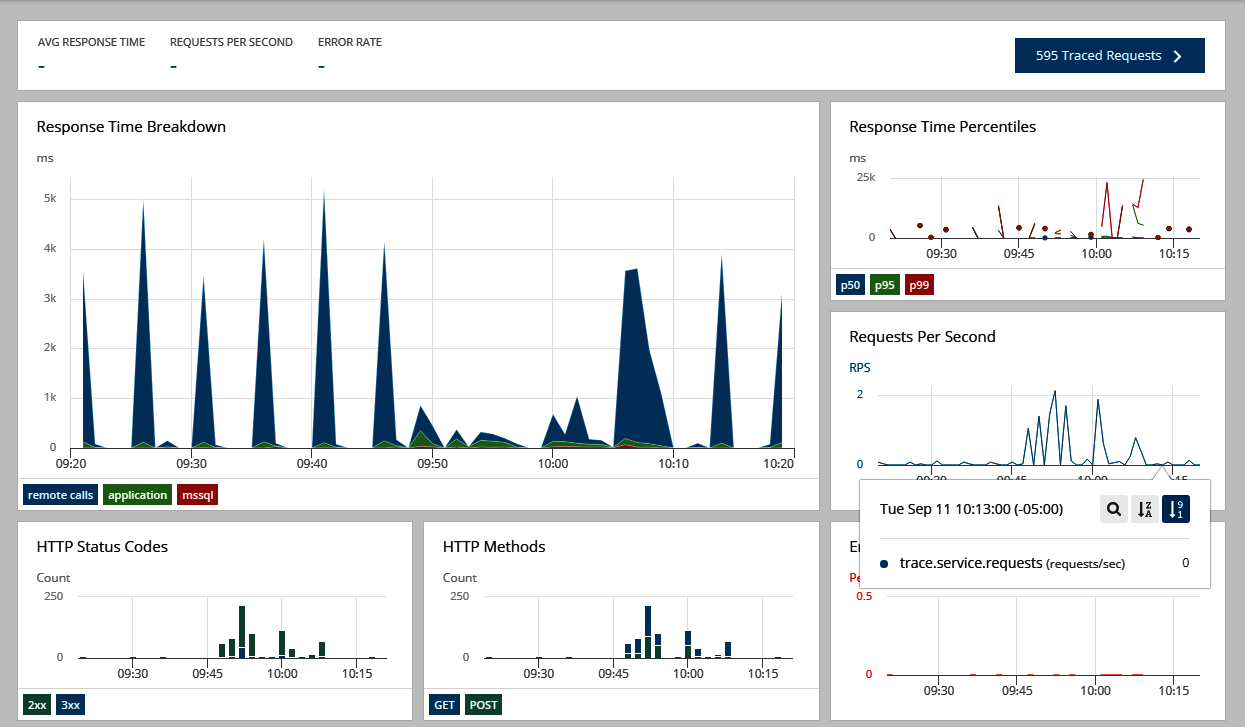
To learn more about using AppOptics, click here.