Add unknown nodes to the SolarWinds Platform
Messages received from an unknown network node are discarded until you add the device through Node Management. When log activity is observed from an unknown device, you receive a notification in the SolarWinds Platform Web Console linking you to the Events page, where you can add the node as a managed device.
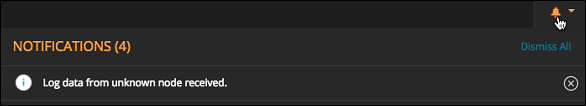
- Click the notification to view the message details on the Events page.
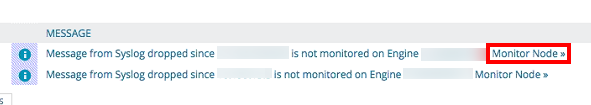
- To add the node as a managed device, click Monitor Node.
The Add Node page prompts you to define the node configuration settings.
- Type the hostname or IP Address of the node you are adding (if not present). Both IPv4 and IPv6 are supported.
- Select a Polling Method:
- External Node: Reports no status for node itself but is useful for monitoring a hosted application.
- Status Only: ICMP reports status, response time, and packet loss only.
- Most Devices: SNMP and ICMP default polling method typically used for routers, switches, and Linux/Unix servers. Make sure to specify a community string if using one other than "public."
- Windows Servers: WMI and ICMP
- Windows and Linux Servers: Agent
- VMware vCenter or Hyper-V devices
Click Test to verify your settings are valid before continuing.
- Scroll down to the Log and Event Monitoring section.
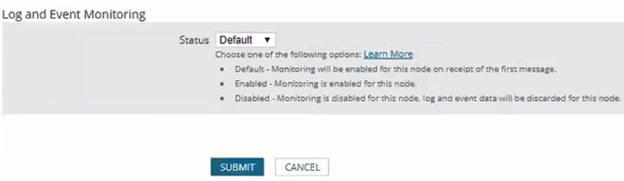
Choose one of the following options from the Status drop-down list:
- Default: Monitoring will be enabled for this node on receipt of the first message.
The Default setting applies to syslog and SNMP trap messages only. Windows and VMware events must be manually set to Enabled or Disabled. Log monitoring is automatically enabled by log profile creation.
- Enabled: Monitoring is enabled for this node.
- Disabled: Monitoring is disabled for this node. Log and event data will be discarded for this node.
- Default: Monitoring will be enabled for this node on receipt of the first message.
- Select the Additional Monitoring Options, and then click Next.
- Select the resources and statistics to monitor for the added node, and then click Next.
- On the Change Properties tab, under Polling, edit the default polling settings if desired.
- Node Status Polling: The number of seconds between status checks performed on the added node.
- Collect Statistics Every: The period between updates made to displayed statistics for the added node.
- Under Custom Properties, add appropriate values if you defined custom properties for monitored nodes.
- When you have completed the properties configuration, click OK, Add Node.
The added node appears in the Config Summary.