Display application dependency data in SAM
As Application Dependency polling and Connection Quality polling (if enabled) occur, the latest data populates these parts of the SolarWinds Platform Web Console:
- The Application Connections widget on Node Details and Application Details views, as described next.
- The Connection Details page that you can access via the Application Connections widget.
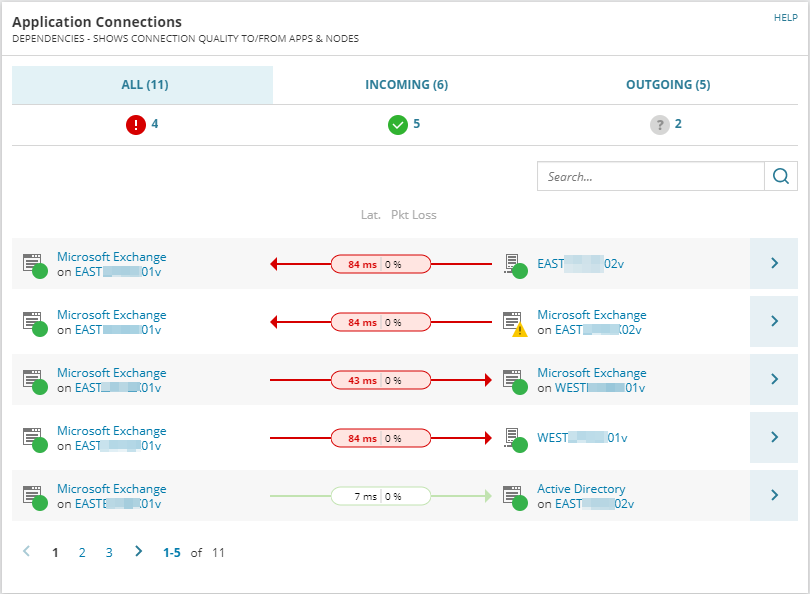
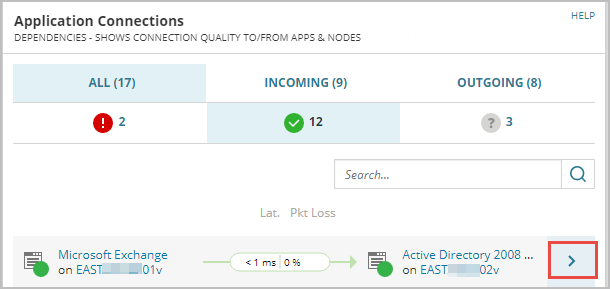
Application Connections widget
The Node Details and Application Details views display the Application Connections widget if Application Dependency polling detects these types of dependencies:
- Application-to-application, including application processes
- Application-to-node
- Node-to-application
The Application Connections widget does not appear automatically on cloned, custom versions of Node Details and Application Details views.
- To add a widget to an individual view, see Add widgets to SolarWinds Platform views.
- To add a widget to a dashboard, click Settings > All Settings > Manage Dashboards. See Customize modern dashboards.
Sample data appears in the Application Connections widget if no dependencies are detected, or if a node does not host an application dependency agent plugin. To deploy agents and agent plugins, assign at least one application monitor to each node you want to monitor.
If Connection Quality polling is enabled, the Application Connections widget displays the following data about TCP connections:
- Latency: The time required for a packet to travel across a network path from a sender to a receiver, also called response time. The higher the latency, the greater the impact on application performance as perceived by users. If necessary, troubleshoot latency with Performance Analysis (PerfStack) dashboards.
- Packet Loss: The percentage of packets lost for the node with respect to packets sent. Packet loss is usually caused by network congestion.
Tip: If nodes exceed SolarWinds Platform thresholds, add the Nodes with High Packet Loss widget to the SAM Summary page to display nodes with similar issues. See Add widgets for details.
Similar to Spotlight functionality in AppStack, you can click connection types and status indicators at the top of the widget to filter data.:
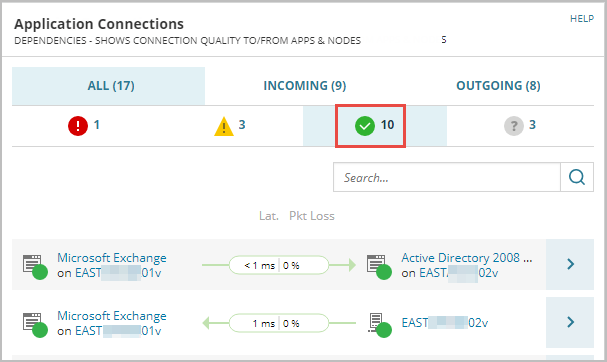
Interpret colors and symbols in the Application Connections widget
SolarWinds Platform products use icons as a visual language to describe the status of items such as nodes, interfaces, events, or alerts. Values that exceed SolarWinds Platform thresholds appear bold on a colored background, as shown next.
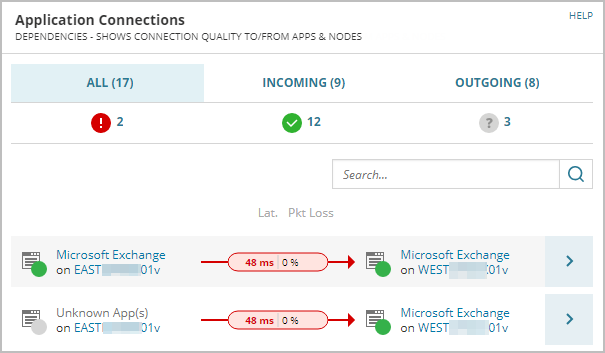
Gray indicates that either:
-
The current status of a node or application is Unknown, or
-
Displayed data is restricted by SolarWinds Platform account limitations.
To display
You must have permission to view
Node-to-node links
Both parent nodes.
TCP connections and statistics about latency and packet loss
Both parent entities — either nodes or applications.
Applications and application processes linked to a node
The parent node.
Network connection thresholds for a node
The parent node.
For a more granular picture of dependencies, use the Connection Details page, as described next.
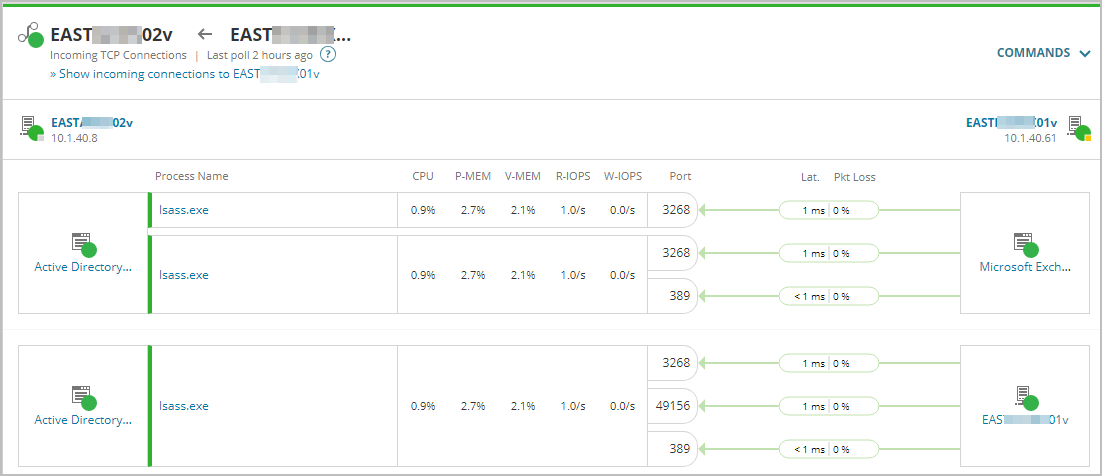
Connection Details page
If Connection Quality polling is enabled, the Connection Details page can show the entire communication stack between nodes with dependencies, making it a unique troubleshooting tool.
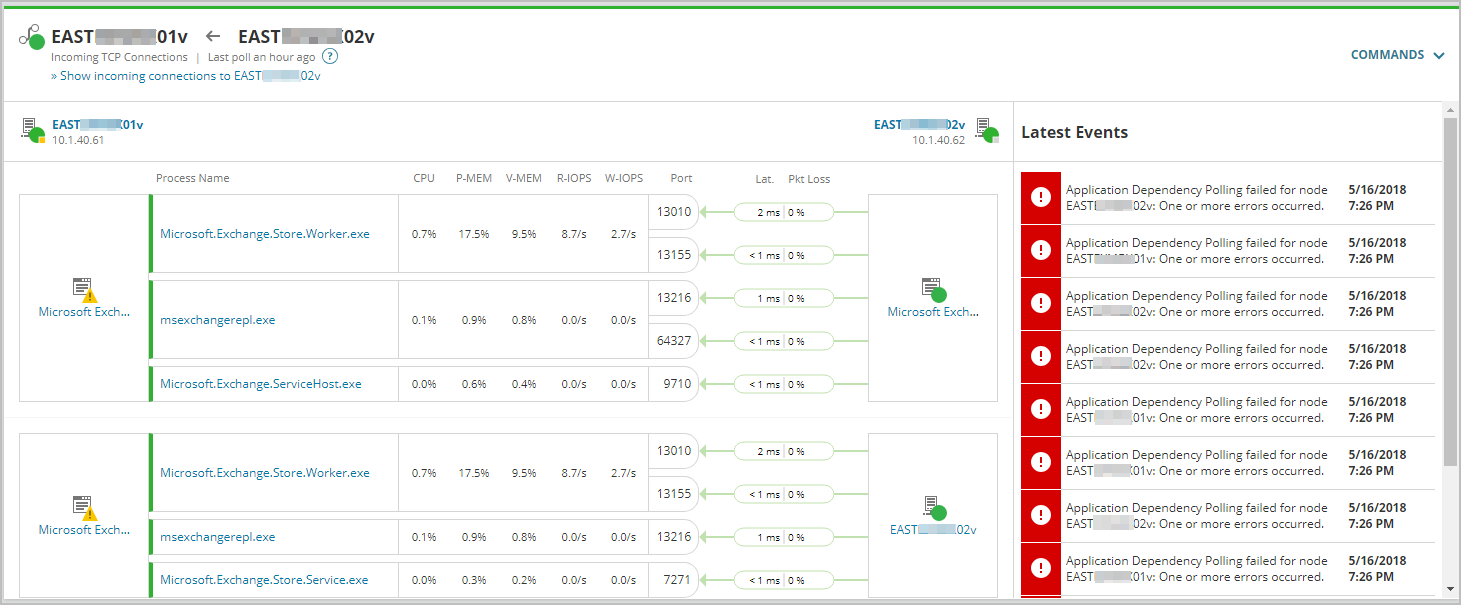
Data displayed on the Connection Details page includes:
- The application name and detected process names, such as mysql.exe.
- Monitored TCP metrics, including:
- CPU: The percentage of CPU utilization.
- P-MEM: The amount of physical memory used.
- V-MEM: The amount of virtual memory used.
- R-IOPS: Read input/output operations per second.
- W-IOPs: Write input/output operations per second.
- The port used by the application process.
- Latency and packet loss metrics (if Connection Quality polling is enabled).
- Latest Events details.
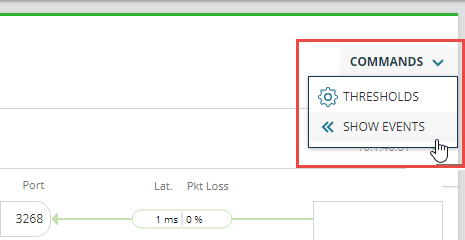
You can also use the Commands menu to configure thresholds, initiate polling, or hide events.
To access the Connection Details page:
-
Access a Node Details view or Application Details view in the SolarWinds Platform Web Console.
-
Click the > arrow next to a connection displayed in the Application Connections widget.
-
The Connection Details page opens.
-
(Optional) Click an option on the Commands menu to:
-
Configure network connection thresholds.
-
Initiate Application Dependency polling immediately.
-
Show or hide events.
-
- Menu options vary based on account permissions.