Monitor cloud instances and VMs in SAM
This section provides an overview about monitoring your cloud infrastructure. See Monitor your cloud infrastructure in SAM and the SolarWinds Platform Administrator Guide for more details.
Cloud service platforms provide on-demand computing resources to third-party organizations over the Internet. As organizations migrate systems to the cloud to distribute workloads, deliver applications, and expand resources for growing databases, infrastructure can become difficult to map in sprawling environments, leading to lost resources or hidden instances.
To support hybrid environments, the SolarWinds Platform can retrieve data from Amazon Web Services (AWS) and Microsoft Azure cloud service platforms to track availability, performance, applications, and more for instances and VMs. Examples of data gathered include status, storage capacity, memory usage, and IP addresses.
After configuring cloud accounts, you can use the Cloud Infrastructure Monitoring feature to:
- Manage hybrid environment metrics and status through a single console so you can compare performance, locate bottlenecks, and better plan capacity and resource allocation.
- Track end user and business context for performance by gathering extended metrics that provide visibility into cloud and on-premises systems.
- Dynamically monitor cloud instances and VMs to better handle resource churn during provisioning. Instances and VMs can be removed as needed to support expanding environments or performance peaks.
- Determine usage trends and troubleshoot issues. Captured metrics over time provide historical references to track trends for resource consumption (such as CPU spikes and lulls) and help determine when those trends become issues.
- Use cloud monitoring data, SolarWinds Platform alerts, and the Performance Analysis dashboard (PerfStack) feature to review historical performance and pinpoint when significant usage changes began to trigger issues.
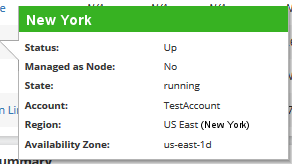
For example, add a series of EC2 cloud instances for an AWS account for the east coast. Select My Dashboards > Cloud to review overall AWS infrastructure data and cloud details. Use the Cloud Instances Status Summary and Cloud Server Infrastructure widgets to review status and health at-a-glance. To quickly review cloud status, metrics, and node management details, hover over any cloud instance name.
The tooltip provides quick information for the cloud service and status.
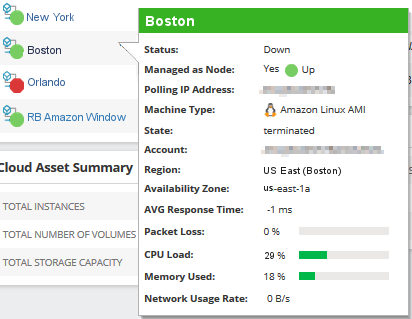
When managed as a node, the tooltip provides enhanced data.
Cloud instances encountering issues display in the following widgets with linked instances and nodes to investigate:
- Active Cloud Alerts lists all active alerts affecting monitoring and managed cloud instances.
- Cloud Applications with Problems lists all applications with issues on cloud instances managed as nodes in SAM.
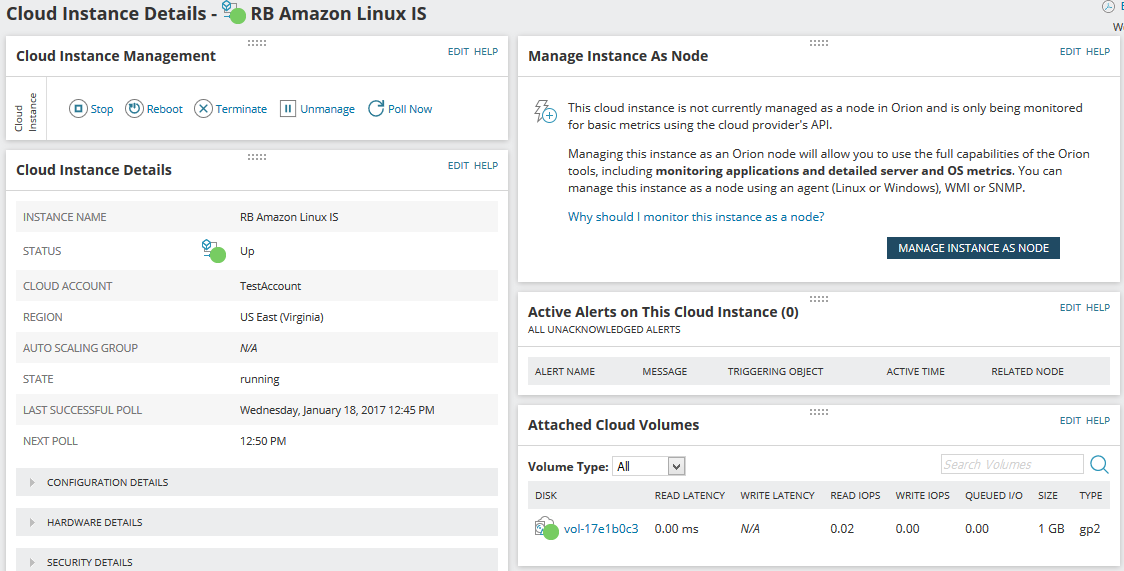
Select a cloud instance or VM to view its Details page. Exceeded thresholds are highlighted in warning and critical values, charts, and graphs with hover-over points to compare collected data and linked alerts. The following widgets provide important data to determine issues, as well as track performance and usage trends:
- Active Alerts lists all active alerts affecting the cloud instance.
- Min/Max/Average of Average CPU load displays average CPU load collected and calculated for the cloud instance.
- Min/Max/Average of Network Utilization provides a chart of the minimum, maximum, and average bits per second transmitted and received over a cloud instance for a custom period of time.