Why does Pingdom say my site is down, when it is not?

It may happen that you find yourself in a situation where Pingdom reports that your site or server is unavailable, but you clearly know it's up and running. False positives or false alerts are technically not possible with Pingdom due to the nature of our second opinion testing. No alert or downtime is ever logged without different locations confirming that there is indeed an outage.
Don't be too eager to yell false positives though, as alerts and outages depend heavily on how you configure Pingdom and how the Internet at large works!
In such cases, there may be many reasons that can explain the discrepancy, and we try our best to give you some idea of what is going on.
The most common reason we report an outage is that a firewall or Access Control List blocks our servers for some reason (they're bots after all). So make sure you white-list all our probe servers, the lists are here.
First of all, note that Pingdom is an external monitoring service. This means that our probe servers, located around the world, will connect to your site or server from outside the local network where it's hosted. Therefore, your site or server may still be locally accessible even though Pingdom can't access it.
When one of our probe servers cannot connect to a site or server, Pingdom's system will first mark the check as Unconfirmed Down and then ask another probe server to try to make the same connection, we call this a Second Opinion, we try to make the second opinion as geographically different as possible to make it easier to determine where the issue is. Your check (site or server) will only be marked as confirmed Down if the second test fails. It will continue to be marked as Down as long as consecutive probe requests register errors.
To find out what caused the outage, look at the Root Cause Analysis and Test Result Log, which will show you further details about the outage.
The Test Result Log, as the name implies, is the data our probes report for each request to your URL they make. It contains the response time as well as the error the probe detected. The Root Cause Analysis is an additional tool that is run from the same probe that detected the issue first and asked for a second opinion and also from the probe conducting the second opinion. The Root Cause Analysis contains a bit more data than what the regular checks are configured to gather, such as a traceroute and the content of the returned data.
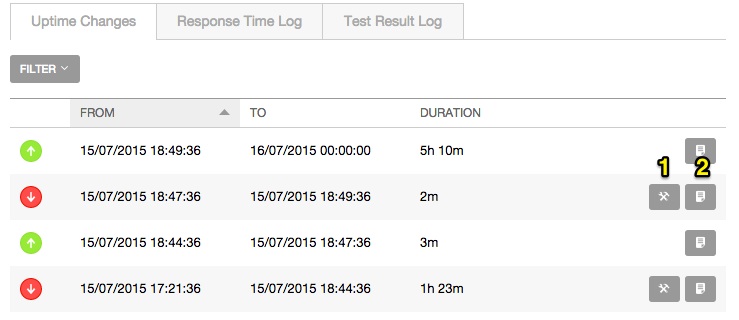
- The Root Cause Analysis.
- The Test Result Log
If the outage was short (less than one or a few minutes) or was intermittent, it was most likely caused by a temporary issue somewhere between the probe server locations and your site or server. Due to the nature of short issues and the ephemeral nature of the internet it's sometimes almost impossible to determine the exact cause.
Some common outage reasons and their most common causes:
Timeouts (30 seconds to connect to site, load HTML), mostly caused by either our servers being blocked or the site being really really slow.
HTTP Error 403, our servers are being forbidden from visiting the site. Again this is most likely caused by a block against our servers, or the site showing an error page that forbids people to view it.
HTTP Error 500/502/503, something is wrong with this server. Or the server is showing Pingdom servers an error page.
Navigation Notice: When the APM Integrated Experience is enabled, Pingdom shares a common navigation and enhanced feature set with other integrated experience products. How you navigate Pingdom and access its features may vary from these instructions.