Access the Patch Manager Summary view
The Patch Manager Summary view displays the patch status of your managed systems in the SolarWinds Platform Web Console. After you locate an issue in your deployment, you can access the Patch Manager Administrator Console and troubleshoot the issue.
See the SolarWinds Platform Administrator Guide for details about customizing the SolarWinds Platform Web Console look, views, settings, charts, and maps.
About the widgets
The Patch Manager Summary view includes widgets that notify you about vulnerabilities in your monitored servers and desktop systems. If the Patch Manager Summary view indicates an issue in your deployment, you can generate a Patch Manager report in PDF or Microsoft Excel format and send the report to your IT team to resolve the issue.
Widgets present important high-level information in an easy-to-read graphical format, such as graphs or drop-down menus. They provide information about specific aspects of your deployment, such as system health, available patches, and systems that require critical operating system updates.
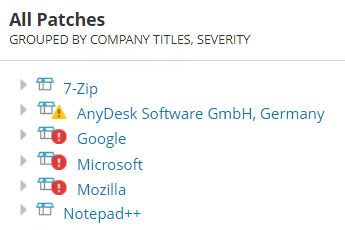
Below is an example of the All Patches widget in the Patch Manager Summary view located at My Dashboards > Patches > Patch Manager Summary.
Identify the patch severity
Some widgets include icons that indicate the risks associated with known vulnerabilities identified by Microsoft and third-party software manufacturers. These icons warn you that the patch is required to prevent unauthorized access to your system.
You can review the details about each patch by maximizing the category (such as Adobe) and hovering over each patch. Click the patch link for specific details.
The following table describes the severity icons that display in the widgets.
| Icon | Severity | Description |
|---|---|---|
|
|
Critical | May prevent malicious code from executing on a system without the user's knowledge. |
|
|
Warning | May prevent user identity or data from being compromised by a third party. |
|
|
Moderate | May prevent unauthorized access by a third party based on authentication requirements or system configuration. |
|
|
Unspecified or Low |
No severity or low severity to the managed system. You must evaluate whether the patch applies to your managed systems. |
View additional resource information
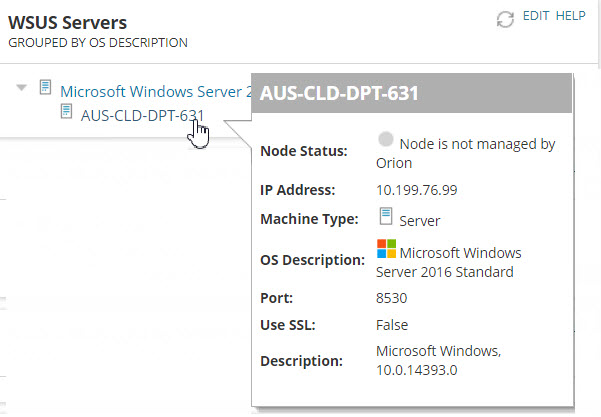
Some widgets use popovers that display additional information about a patch or system. These popovers appear when you hover over a monitored object or patch in the SolarWinds Platform Web Console. They provide additional information and quick access to commands without taking up space or cluttering the page with too much information.
Below is an example of a popover that displays when you hover over a WSUS server link in the WSUS Servers widget.
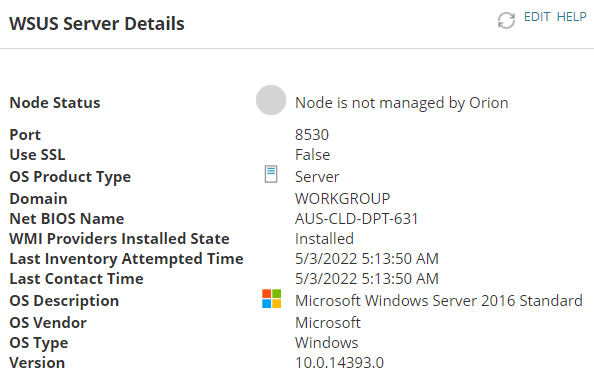
Some widgets include links to additional information about a resource (such as a node or WSUS server) that provide additional information. Below is an example of a details window that displays when you click a WSUS server link in the WSUS Servers widget.
See Calculate node status in the SolarWinds Platform located in the SolarWinds Platform Administrator Guide for details.
Explore the widgets
This section describes the widgets that display in the Patch Manager Summary view.
All Patches
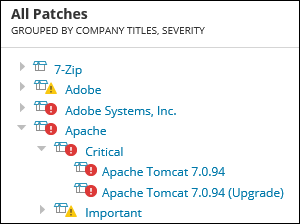
This widget displays all patches that were published to your WSUS server. Maximize each company title to access the patches. Hover over each patch for details about the patch.
Desktop Node Health Overview
This widget displays all desktop systems by patch status that are managed by your WSUS server.
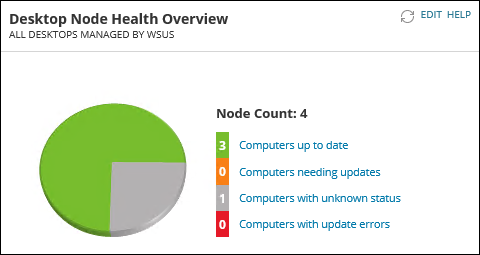
When you click a category such as Computers up to date, a legend page displays with additional details.
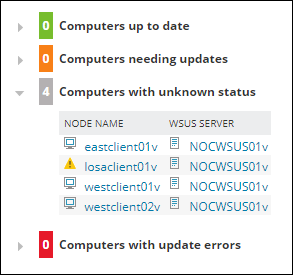
From here, you can maximize a category (such as Computers with unknown status) to view the nodes and corresponding WSUS server. You can hover over a node or server name to view general information, or click one of these links to view details about the system.
Last 10 Tasks
This widget displays the last ten tasks that were initiated in your deployment. These tasks correspond with the last 10 tasks in Task History located under Administration and Reporting in the Administrator Console.
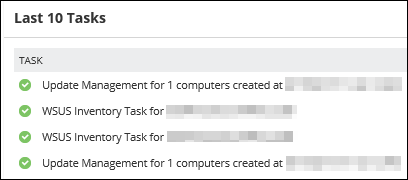
Latest 10 Patches on WSUS Servers
This widget displays the last ten patches by product that were published to your WSUS servers. The widget includes details about the severity, installation, and arrival date for each product title.
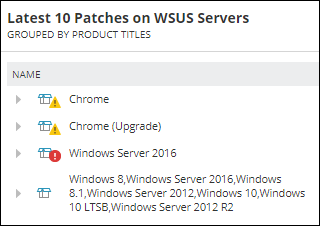
Maximize a product title to view the related patches. From here, you can hover over a patch to view the patch description, or click the patch link to view detailed information about the patch.
Nodes Managed by WSUS Servers
This widget displays the WSUS servers in your deployment and the servers and workstations managed by each WSUS server.
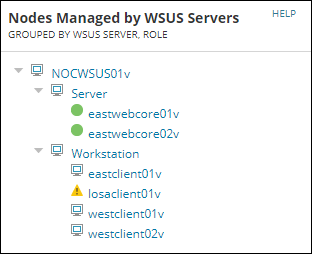
You can maximize a category to view the nodes that are managed by the corresponding WSUS server, along with their node status.
Hover over a server to view information about the server, such as the polling IP address, Windows Server operating system version, and the percentage of used memory.
Click the patch link to view detailed information, which includes the last synchronization date and the server make and model.
Nodes Managed by WSUS Servers by Target Groups
This widget displays the WSUS servers in your deployment and the target groups (such as All Computers and Unassigned Computers) managed by each WSUS server.
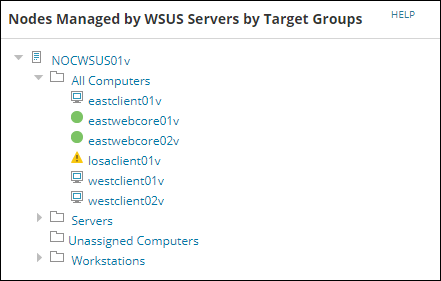
You can maximize a target group (such as All Computers or Unassigned Computers) to view the nodes and their node status in that group. Nodes in a category that are not managed by a WSUS server display the ![]() icon next to the node name.
icon next to the node name.
Hover over a server to view information about the server, such as the IP address, Windows Server operating system version, and the WSUS server IP address. Click the node link to view detailed information, which includes the node IP address and the node make and model.
Operating System Overview
This widget displays the number of servers and workstations managed by your WSUS servers based on their Windows operating system.
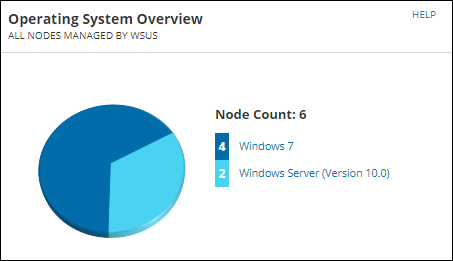
Click an operating system to view the legend details. From here, you can view the nodes, node status, and their corresponding WSUS servers.
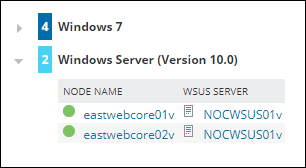
Hover over a node or WSUS server link to view general information such as the polling IP address, server name, and used memory. Click a node or server to view details about the system, such as the processor type and the server make and model.
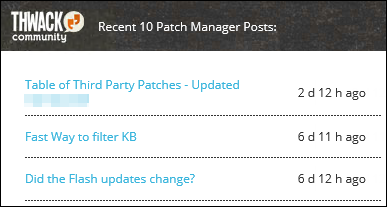
Recent 10 Patch Manager Posts
This widget displays the 10 most recent Patch Manager comments posted in the Product Forum on THWACK. Click a link to view the article on the THWACK website.
Server Node Health Overview
This widget displays all Windows-enabled servers by patch status that are managed by your WSUS server.
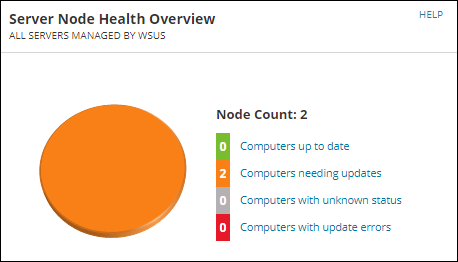
Click a category link to access the legend details. From here, you can maximize a category to view the nodes, node status, and corresponding WSUS Server.
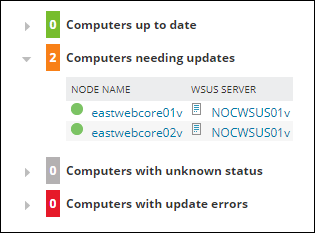
Hover over a node or server name to view general information, such as the polling IP address, update details, and memory used in the system. Click a node or server to view addition details about the system, such as the last sync time, processor type, and the make and model of the system.
Top 10 Patches Missing
This widget displays the top 10 patches that need to be updated on your managed systems, including the number of systems that require the patches.
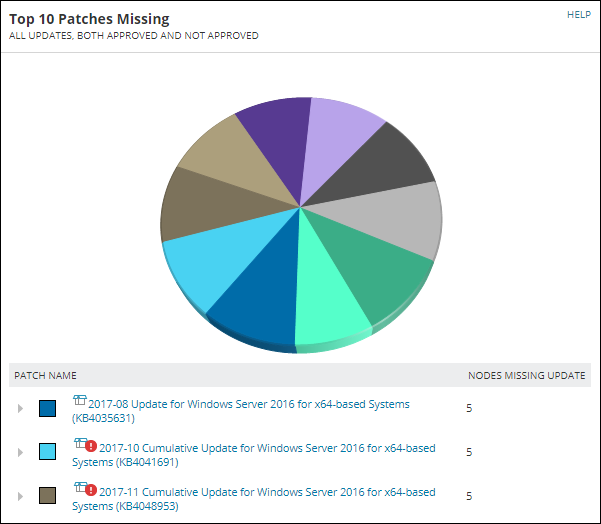
Hover over a patch name to view the description. Maximize the patch name to view the node associated with the patch.

Hover over the node or WSUS Server name to view general information about the node, such as the polling IP address, update details, and the percent of memory used on the system. Click the node or WSUS server name to view details about each node, such as the last sync time and result, processor type, and the system make and model.
Top 10 Most Vulnerable Machines
This widget displays the top 10 servers and workstations in your environment that are missing the most patches.
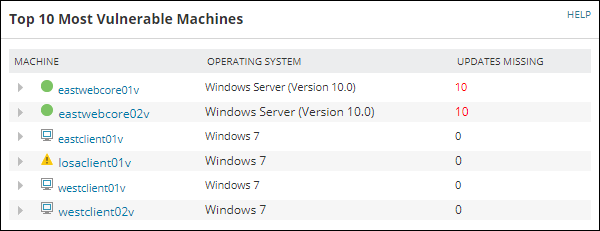
Each machine is listed with their current node status. The ![]() icon indicates that the machine is not managed by a WSUS server.
icon indicates that the machine is not managed by a WSUS server.
The Updates Missing column lists the number of updates missing from the machine. Red values indicate that some updates are critical operating system updates. Expand a machine name to view the required updates.
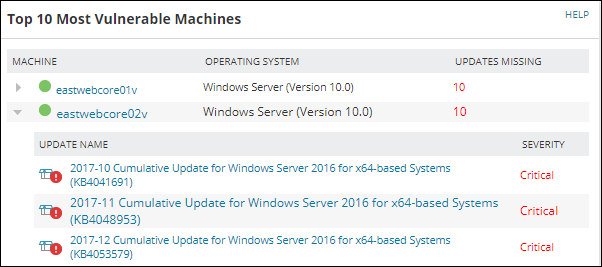
Hover over a machine name to view general information about the machine, such as the machine type (for example, Hyper-V Server or Windows Server), update details, and the percent of used memory on the system. Click a machine name for additional details, such as the last sync time, processor type, and the system make and model.
Hover over an update name to view a description. Click the update for details about the update provided by the software manufacturer.
WSUS Servers
This widget displays all WSUS servers in your deployment grouped by their Windows Server operating system.
Maximize an operating system vendor to view the WSUS server running the targeted operating system. The node name and node status display in the widget.

Hover over a server to view information about the server. This information includes the polling IP address, server health, and the percentage of used memory.
Click the WSUS server link to view detailed information about the server. This information includes the domain name, NetBIOS name, and Windows operating system version.
