Monitor Quality of Experience metrics
This SolarWinds Platform topic applies only to the following products:
Hybrid Cloud Observability Essentials — Hybrid Cloud Observability Advanced
NAM — NPM
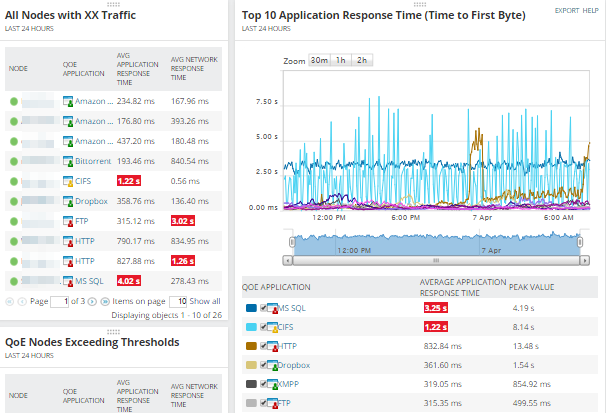
On the Quality of Experience (QoE) dashboard you can monitor traffic on your network. QoE uses Packet Analysis Sensors to provide packet-level traffic information about key devices and applications.
With QoE, you can:
-
Compare statistics, such as network response time (TCP Handshake) and application response time (Time to First Byte) to determine if a bottleneck is on the application or the network.
-
Use data volume trends to pinpoint traffic anomalies and investigate the cause.
-
Monitor risky types of traffic, for example, traffic that might bypass firewalls or lead to data leaks.

With the ability to analyze packet traffic, QoE provides real observed network response time (NRT) and application response time (ART). In addition, Packet Analysis Sensors can classify and categorize traffic for over 1000 different applications by associated purpose and risk-level.
Before deploying Packet Analysis Sensors, see QoE specific Quality of Experience requirements.
Traffic data is captured using Packet Analysis Sensors. These sensors collect packets using either a dedicated Windows SPAN or mirror port monitor or directly on your Windows server. Packet Analysis Sensors capture packets from the local network interface (NIC) and then analyze collected packets to calculate metrics for application performance monitoring. These metrics provide information about application health and allow you to identify possible application performance issues before they are reported by end-users.
For more information about specific implementations of QoE, see Common Packet Analysis Sensor deployment scenarios.
