Add content to a web-based report in the SolarWinds Platform
This topic applies to all SolarWinds Platform products except for the following products:
ETS — LA — WPM
You can add any SolarWinds Platform Web Console widget, including charts and graphs, to a web-based report.
The following procedure assumes you are already creating or editing a report in the SolarWinds Platform Web Console.
Select a widget (chart, table, resource)
-
On the Layout Builder page, click Add Content in the column to which you want to add content.
If you are creating a report, the Add Content pop-up is displayed automatically. Continue with the next step.
-
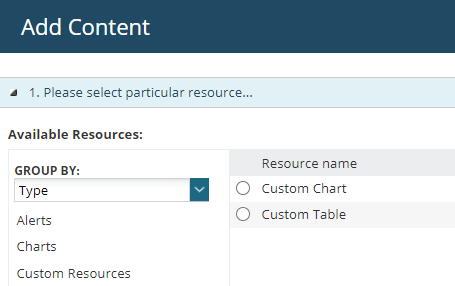
In the Add Content pop-up, use the Search box or Group by filters to find the widget to add.
-
Select the widget, and click Select and Continue.
When you are familiar with the SolarWinds Platform database, or comfortable with creating SQL or SWQL queries, you can create custom charts or custom tables and use them in reports.
To ensure that the charts and tables show meaningful results, you need to know what data you are using, from which instances it originates, and what you do with the data.
Define entities to display in the widget
Select objects to display data for.
You can reuse customized charts or tables by clicking Use previously specified objects when adding the chart or table and then selecting the object.
The definition depends on the resource you selected.
-
Single entity: some widgets require specifying a single node, a single group or other single entity.
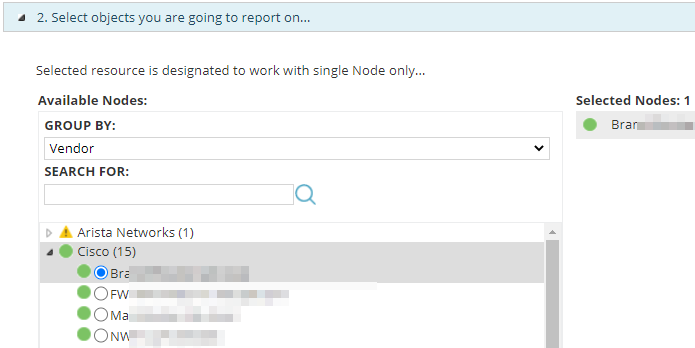
-
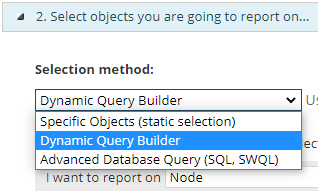
Multiple entities: specify what entities to report on - you can select multiple objects, use the dynamic query builder, or SQL or SWQL. See Selection methods.
Dynamic Query Builder is the default option for custom tables and custom charts. By default, the report will display data for all monitored nodes. See Selection methods in Add content to reports.
-
No entry required: the widget shows details for the entire monitored environment (for example, all active alerts, all nodes, or last 25 events in your environment,...)
Add the content to layout
Click Add to Layout on the Add Content pop-up.
If you selected a chart, table, or resource that requires further configuration, the configuration screen opens.
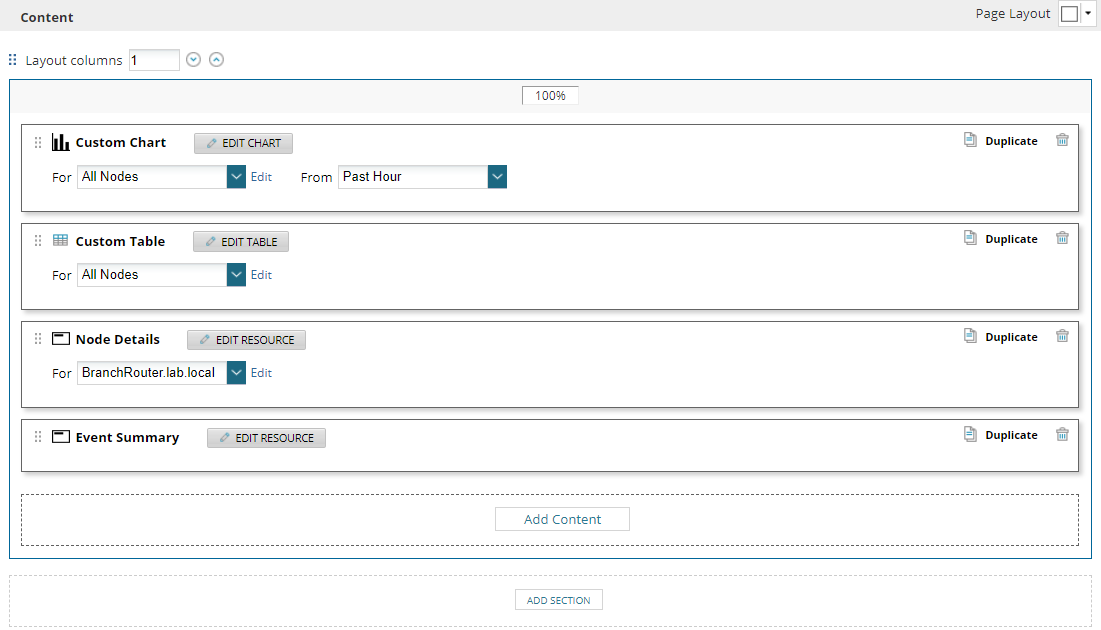
When you return to the Layout Builder screen, you can further edit the added content (click Edit Chart/Edit Table/Edit Resource).
You can have multiple widgets in one section or drag widgets between sections. See Customize a web-based report layout in the SolarWinds Platform.
After you have added content, the Layout Builder screen might look like this: