Troubleshooting Nxlog
Navigation Notice: When the APM Integrated Experience is enabled, Loggly shares a common navigation and enhanced feature set with other integrated experience products. How you navigate Loggly and access its features may vary from these instructions.
Use these tips to troubleshoot problems with Nxlog. You can check the nxlog configuration, send sample data, and check connection. Additionally, you can read the Nxlog Configuration docs.
Wait a Few Minutes
Wait a few minutes after sending an event to give it time to index and appear in the search results. It normally happens within seconds, but sometimes it can take longer.
Check Loggly Status
If Loggly isn’t seeing data check our status page to make sure we are indexing data and search is running. You should see green dots and "All Systems Operational".
Restart Nxlog
Make sure you restarted nxlog so your changes in nxlog configuration file take effect. Open the Services tool in the Start menu, find nxlog in the list, and then restart the service.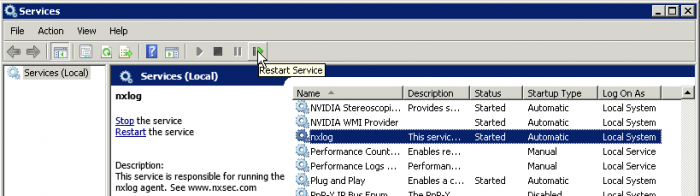
Check your Nxlog configuration
Make sure you don’t see any of these common configuration problems:
- Check to make sure that you replaced the customer token in nxlog configuration file.
- If you are on 32-bit Windows make sure you replaced the ROOT and ROOT_STRING variables
Check Nxlog log file
If your logs haven’t made it to Loggly yet, open up the nxlog log file and see what’s going on: C:\\Program Files*\\nxlog\\data\\nxlog.log
Debug Output
In order to see what’s actually sent over to Loggly, edit your nxlog configuration file: Add this section with the other Extensions:
<Extension fileop>
  Module  xm_fileop
</Extension>
This line should go into the Output module that you’re debugging:
Exec file_write("C:\\Program Files (x86)\\nxlog\\data\\nxlog_output.log", $raw_event);
Check Connection
Sample Error Messages:
2013-06-04 16:35:59 ERROR couldn't connect to tcp socket on 192.168.1.1:514; A connection attempt failed because the connected party did not properly respond after a period of time, or established connection failed because connected host has failed to respond.

2013-06-04 16:36:00 INFO connecting to 192.168.1.1:514

2013-06-04 16:36:21 INFO reconnecting in 2 seconds
If you see an error connecting to "tcp socket on 192.168.1.1:514", you’ve probably got an issue with the configuration file. Make sure that you’re editing the configuration file as "Administrator", this means that you should actually open up text editor as Administrator.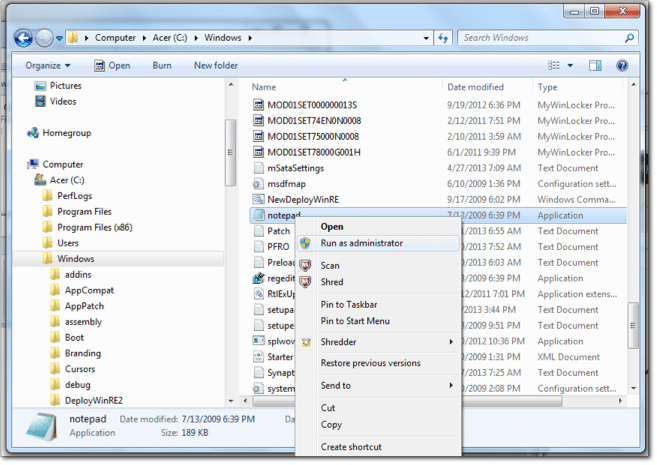
Check Directory Path
Sample Error Messages:
2013-06-04 20:46:48 WARNING nxlog-ce received a termination request signal, exiting...
2013-06-04 20:57:10 ERROR failed to open C:\Program Files (x86);xlog\data;xlog.log; The filename, directory name, or volume label syntax is incorrect.
2013-06-04 20:57:10 INFO nxlog-ce-2.4.1054 started
When you designate a directory path, be sure to escape any special characters, including back slashes.
From
File "C:\\Program Files (x86)\nxlog\data\nxlog.log"
To
File "C:\\Program Files (x86)\\nxlog\\data\\nxlog.log"
Check Nxlog Configuration
Sample Error Messages:
2013-06-04 21:36:28 ERROR file is already defined at C:\Program Files (x86)\nxlog\conf\nxlog.conf:34
2013-06-04 21:36:28 ERROR module 'file_watch' has configuration errors, not adding to route '1' at C:\Program Files (x86)\nxlog\conf\nxlog.conf:58
2013-06-04 21:36:28 WARNING not starting unused module file_watch
Each input module can only reference one source.Create unique names for each of the input streams. For example:
<Input python_logs>
  Module  im_file
  File   "C:\\Your Project\\Python\\mylog.log"
  SavePos TRUE
</Input>
<Input apache_logs>
  Module  im_file
  File   "C:\\Program Files (x86)\\Apache Group\\Apache2\\logs\\error.log"
  SavePos TRUE
</Input>
Double check that your Route module has the complete list of Input modules. For Example:
<Route 1>
  Path internal, python_logs, apache_logs, eventlog => out
</Route>
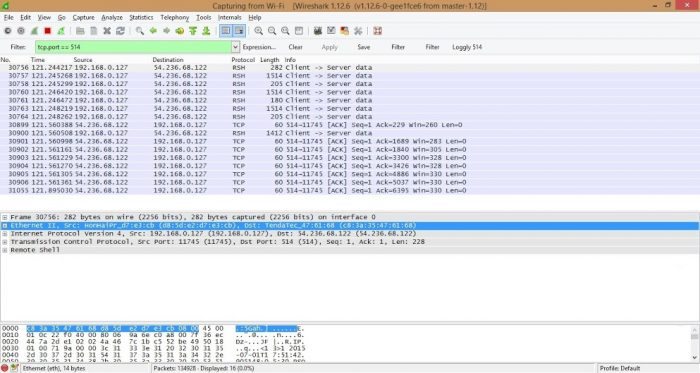
Check Using Wireshark
Wireshark is network protocol analyzer. It lets you see what’s happening on your network. You can track network traffic to Loggly on port 514 and see if anything is going wrong. You can use the following filter query in the Wireshark.
tcp.port == 514
Still Not Working?
- Read the Nxlog Reference Manual for troubleshooting tips in Chapter 12
- Search the nxlog-ce-users mailing list for answers to common problems
- Please search our community forum for more Nxlog configuration answers or post your own question.
The scripts are not supported under any SolarWinds support program or service. The scripts are provided AS IS without warranty of any kind. SolarWinds further disclaims all warranties including, without limitation, any implied warranties of merchantability or of fitness for a particular purpose. The risk arising out of the use or performance of the scripts and documentation stays with you. In no event shall SolarWinds or anyone else involved in the creation, production, or delivery of the scripts be liable for any damages whatsoever (including, without limitation, damages for loss of business profits, business interruption, loss of business information, or other pecuniary loss) arising out of the use of or inability to use the scripts or documentation.