Log Usage Dashboard
Navigation Notice: When the APM Integrated Experience is enabled, Loggly shares a common navigation and enhanced feature set with other integrated experience products. How you navigate Loggly and access its features may vary from these instructions.
The Log Usage dashboard is available only to SolarWinds Unified Login users. If you are logged in using Single Sign-On, log out of Loggly and log back in with your SolarWinds Unified Login credentials. If you are a Single Sign-On user without SolarWinds Unified Login credentials, click here.
The Log Usage dashboard provides insight into your account's recent log usage with at-a-glance metrics for log volume and the hosts and services that sent the most logs. To view your Log Usage dashboard, click Settings and select Account Overview and then click Try it now.
Example:
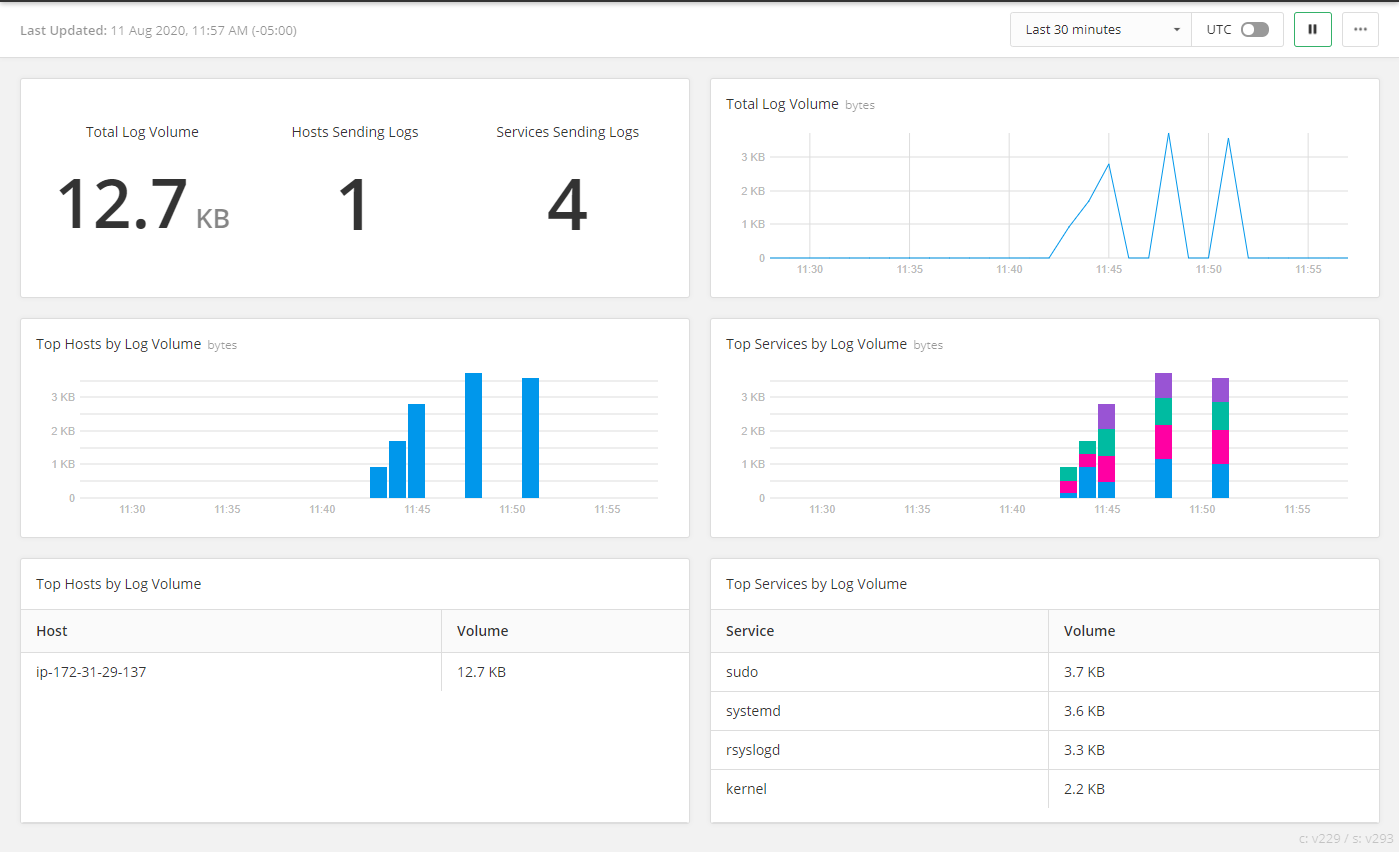
The six panes of the dashboard display your recent log data volume consumption. To change the data display in the panes:
- Click the time window drop-down menu and select an option to define the how much historical data to display.
- Toggle UTC on or off to display time-based charts using either UTC or GMT time along the x-axis.
- Click pause to stop updating the data display in the panes.
- Click the action icon (three vertical dots) in the upper right corner of the dashboard and toggle Dark Theme on or off to display the dashboard with either dark or light surfaces.