Anomaly Detection
Navigation Notice: When the APM Integrated Experience is enabled, Loggly shares a common navigation and enhanced feature set with other integrated experience products. How you navigate Loggly and access its features may vary from these instructions.
Loggly’s anomaly detection allows you to find significant changes in event frequency. Anomalies often indicate new problems that require attention, or they can confirm that you fixed a pre-existing problem. For example, you may want to see if there is a big increase in errors after a new code deployment.
Accessing Anomaly Detection
From the Search or Chart page, select the Chart Type Anomalies.

Using Anomaly Detection
The anomalies trend chart allows you to pick a field to analyze. It then shows you which values of that field have increased or decreased in frequency. It can compare a change between your current search time range and a background time range. It can also identify field values that have had the most significant changes and bring them to the top of the list.
Each anomaly is represented by a gray bar. The gray part of the bar shows the expected count in your current time range using the average count over the background time range. The actual values are plotted as deltas on the expected bar, and they are colored to show increases in green and decreases in red.
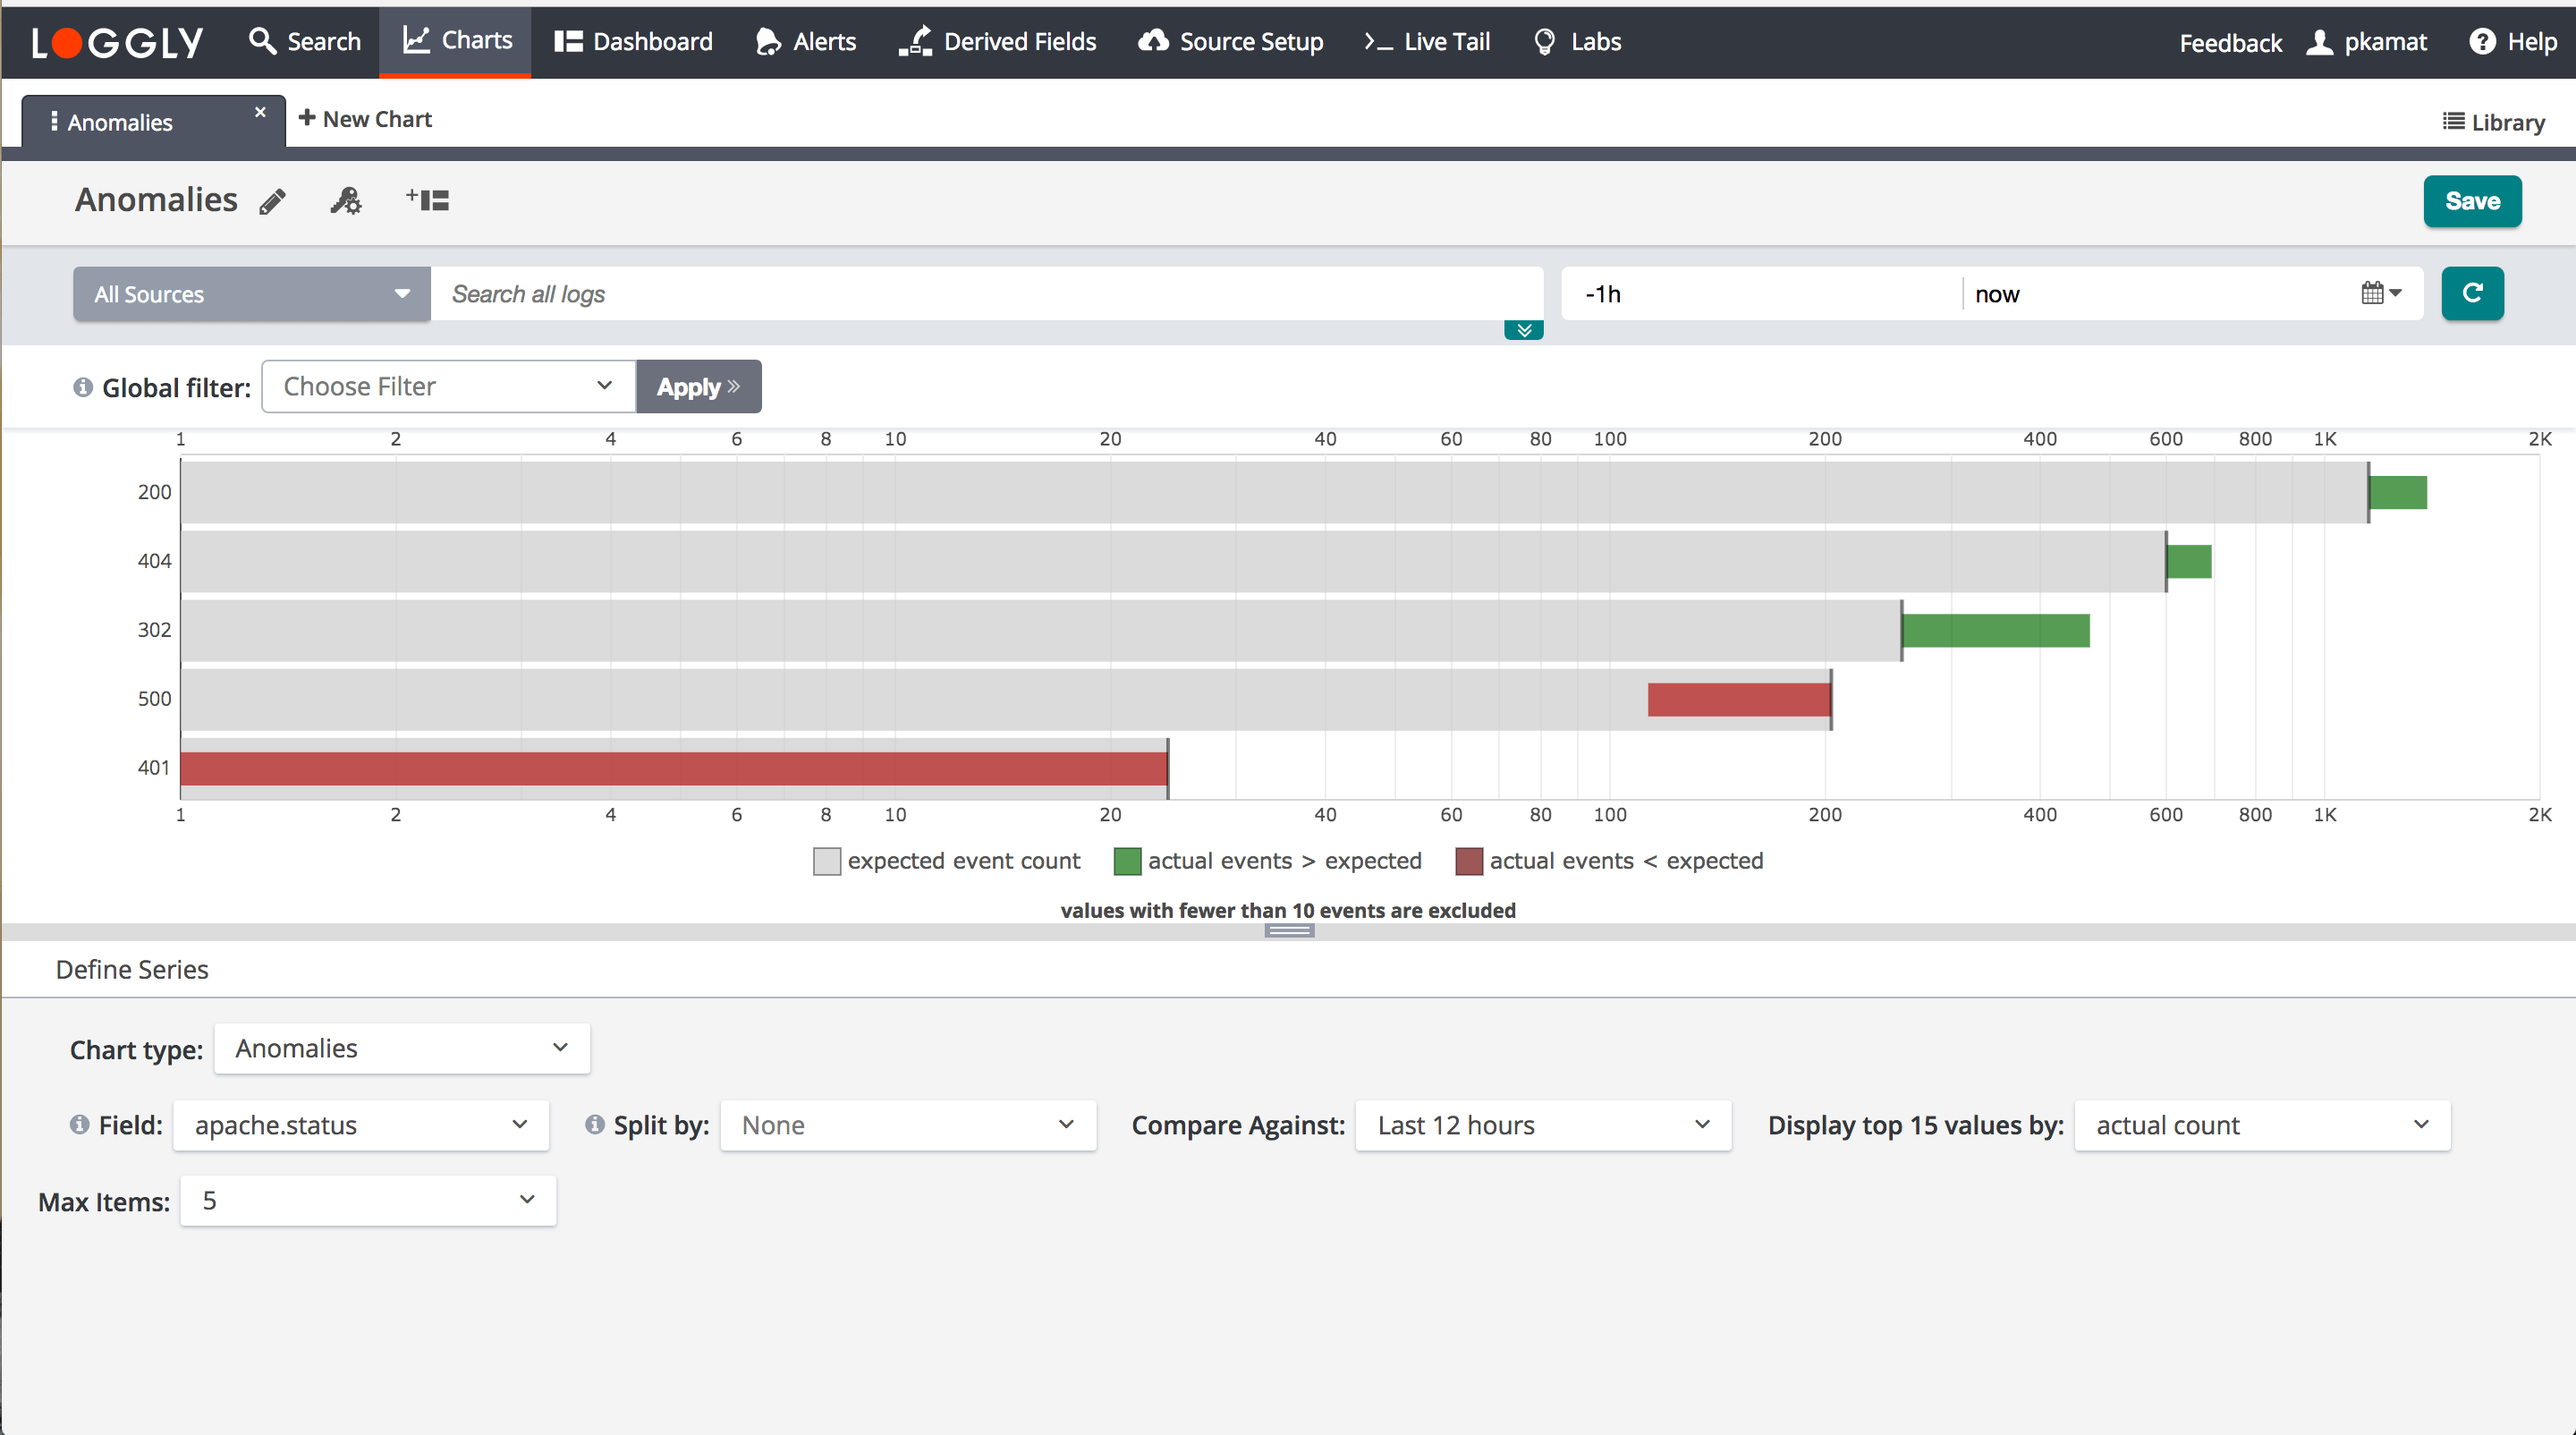
In the example screenshot above, Loggly is analyzing the Apache status code field. You can see that in the last hour the number of 200, 404, and 302 codes has increased, whereas the 500 and 401 codes have decreased. The increased 404 code indicates that the Page not found errors are increasing. This would prevent viewers from seeing pages on the website. If this were for a popular web store, it could be losing a significant amount of revenue.
Compare Against
Compare Against establishes the time range used to calculate the expected count. Loggly compares changes relative to the actual count, which is based on your current search time range. You can also select different time ranges in the dropdown. It might be useful to select a different time range here if there are irregularities or cyclical patterns in your data you want to take into account.
Split By
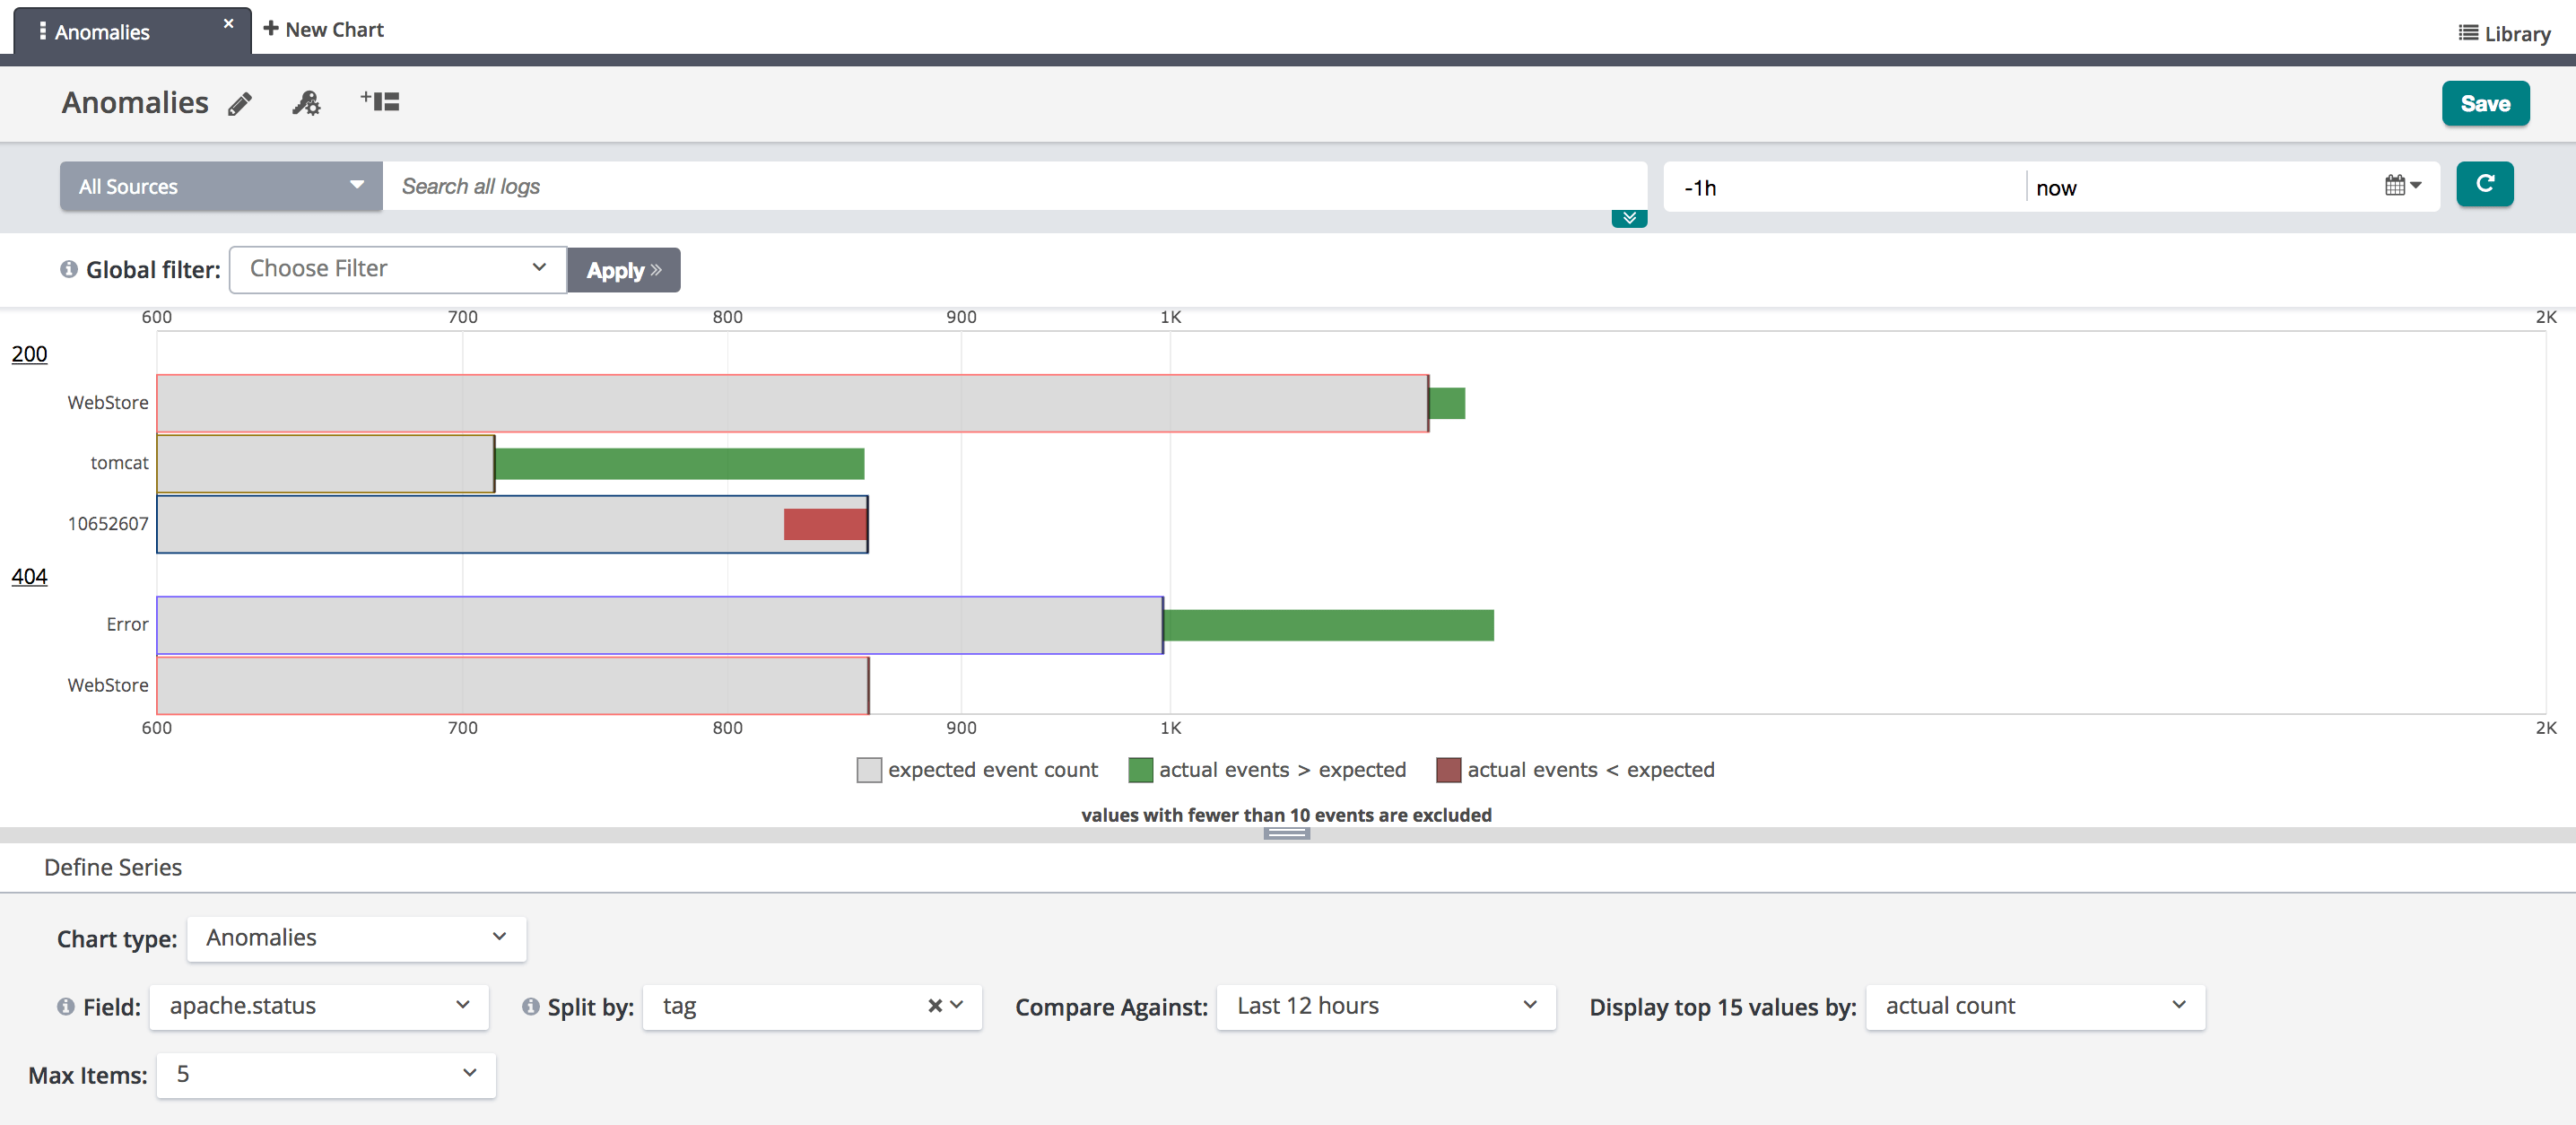
Below is an example of Anomaly Detection using Split By. In this example, the Split By option is set to tag. Other options are available from the drop-down list.
Sort
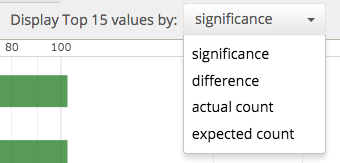
Loggly provides a variety of sort options. The default is significance, which picks the values with the biggest changes that also had larger counts overall. You can also sort by percent difference between the actual and expected counts, by the actual count in your current time range, or by the expected count from your background time range.
Other Settings
The settings menu is shown as a gear icon. Loggly allows you to control how many bars are displayed, whether to show as log scale, and whether to show the legend.
Common Error Messages
- Time range out of bounds. The search period is not contained with the compare against, or background, time range.
- Cardinality too high. The split by field has too many values. Currently Loggly can only split by a field with less than 25 unique values.