SQL server monitor
The SQL Server monitor opens a connection to the specified SQL server and tests the performance of its subsystems to determine the server's general health. The overall performance of the server is identified by its weakest performing subsystem.
Administrators can use the SQL server monitor to:
- Use pre-configured performance counters provided by the Windows Management Instrumentation (WMI) service to test multiple SQL Server subsystems at once.
- Identify performance degradation in critical SQL Server components.
- Determine the exact point of failure.
- Take corrective action before outages occur.
The built-in internal sampling incorporated in the monitor helps to combat counter spikes. The monitor issues the WMI query five times—once every second—and calculates an average based on the query results.
If you do not have local account credentials, you can enable cross-domain WMI with Windows impersonation for use with RPC. Credentials using NTLM Authentication Schemes (Windows LT Lan Manager) will function across domains without local accounts.
Create an SQL server monitor
- Verify that:
- WMI is enabled and functioning to monitor the SQL server.
- The remote SQL server is accessible through an RPC connection to run the WMI queries.
- Log in to ipMonitor as an administrator.
- Click Devices in the toolbar.
- Locate and click the targeted device you want to monitor.
-
In the toolbar, click Add > Add New Monitor.
- In the Select Monitor menu, click SQL Server Performance Counters.
-
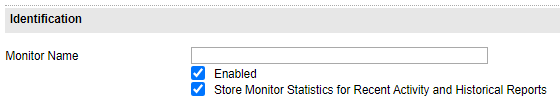
Under Identification, complete the fields and selections.
-
Enter a name in the Monitor Name field using up to 64 characters.
This name will appear in the Monitors List, Monitor Status, Logs pages, and your reports.
You can change this name later, if necessary. ipMonitor does not use this field to internally identify this monitor.
-
Select Enabled to enable the monitor.
When enabled, the monitor tests the specified resource using the settings you enter under Test Parameters. You can disable the monitor later if required.
- (Optional) Select Store Monitor Statistics for Recent Activity and Historical Reports to enable this functionality.
-
-
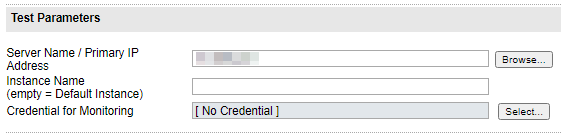
Under Test Parameters, complete the options.
-
Enter the server name or primary IP address of the SQL server.
Click Browse to locate the system in your network.
- Enter the SQL server database instance name you want to monitor. Leave this field blank to select the default instance.
- (Optional) Click Select and assign a credential. When the monitor runs the executable file, it will use the credential account and password combination to authenticate to the machine, directory, or file.
-
-
Under Analysis of Test Results, select the counters you want to enable using WMI.
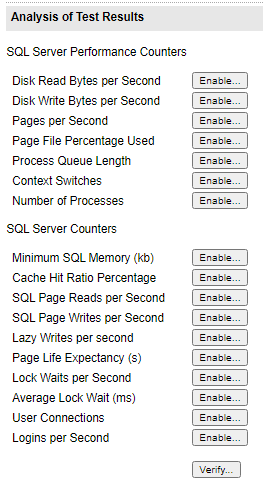
You do not need to enable every counter. The monitor can test all counters during the monitoring process. You can choose to enable the counters that directly relate to the subsystems you wish to monitor.
Except for the Minimum SQL Memory (kb) and the Cache Hit Ratio Percentage counters, the default value represents a threshold rate that cannot be exceeded.
Counters are tested in the order that they appear. If you experience multiple counter failures, only the first counter error encountered will be reported.
-
Click Verify to test the monitor. This ensures that it can connect to the targeted SQL server and retrieve each counter value.
Counters outside the threshold display in red.
-
Under Timing, configure the fields for the monitor testing states.
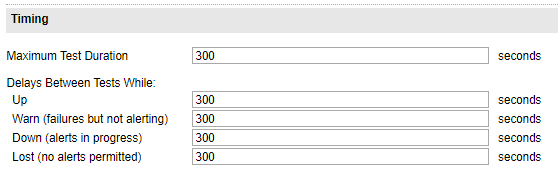
- In the Maximum Test Duration field, enter the maximum test duration rate (in seconds) that the monitor times out before the test is considered a failure.
-
In the remaining fields, enter the number of second between each test while the monitor is in an OK state (Up), a failed state while alerts are processed (Down), and a failed state and the maximum number of alerts have been processed (Lost).
In the Lost state, no additional failure alerts are processed. However, a recovery notification is sent if the monitor recovers.
- Enter the amount of time delay for each monitor testing state. For example, you may choose to intensify testing when a monitor enters a Warn state and reduce testing when the monitor enters a Lost state.
-
Under Notification Control, complete the fields to determine how many test failures must occur before an alert is sent.
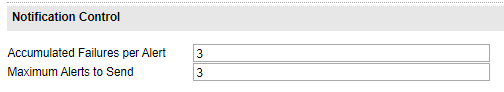
- Enter the number of test failures that occur for each alert before ipMonitor generates an alert for the monitor. The default option is 3.
-
Enter the maximum number of alerts to send before the monitor enters a Lost state.
The monitor must be assigned to a notification alert to generate an action.
-
Under Recovery Parameters, complete the fields to indicate the corrective action used to automatically restore a resource using the External Process Recovery, Reboot Server Recovery, or Restart Service Recovery action.
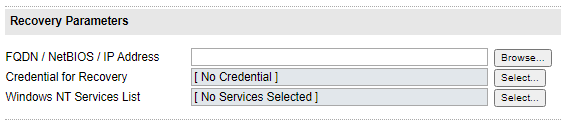
- Enter the Fully Qualified Domain Name (FQDN), NetBIOS, or IP Address of the machine hosting the service that needs a restart or the machine that needs a restart. You can also click Browse to locate and select the machine.
- Select the set of credentials used by the recovery alert. You can select a specific credential to execute recovery alerts that require access to restricted resources, such as Reboot Server, Restart Service, or External Process.
- Select the list of services to restart on the target machine specified in the FQDN/NetBIOS/IP Address field. This field is only required for the Restart Service alert. If a service has dependencies, select all dependent services.
- Click OK.