Embedded Charts
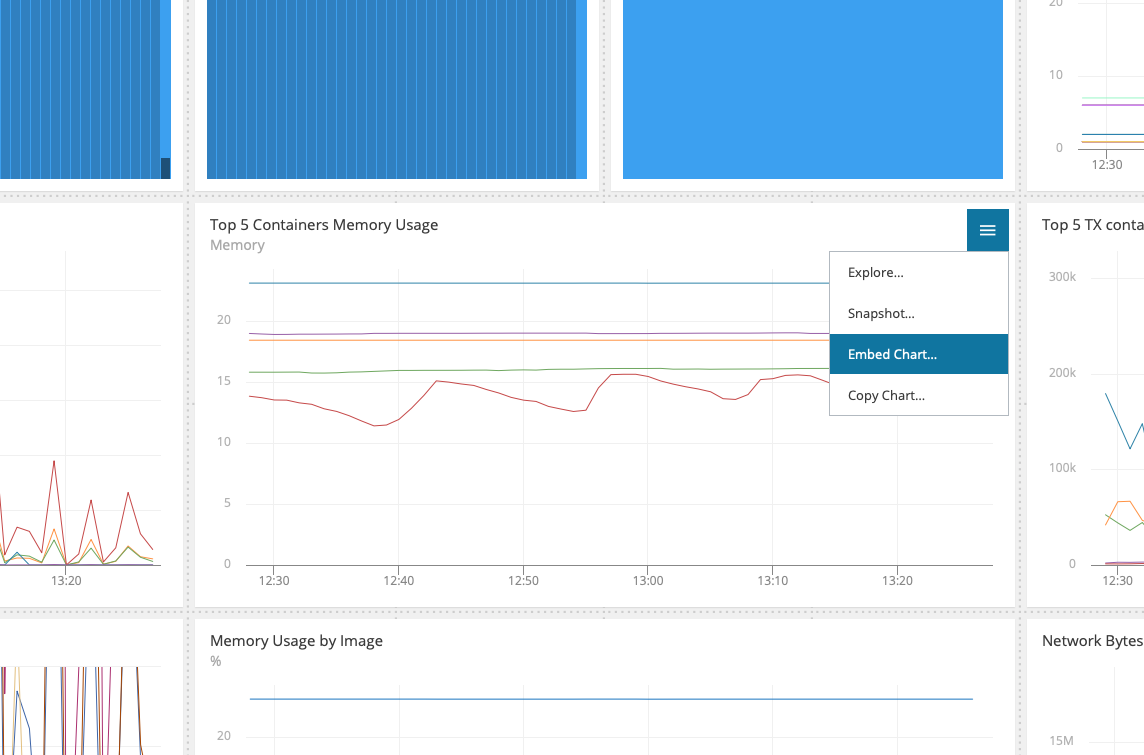
We've made it really easy to embed AppOptics charts into your own application or site. After configuring your tag set, open the dropdown menu within any chart and click on "Embed chart …".
You can then specify different options that control how the graph will be displayed:
- Height and width: control the size of the chart.
- Duration: controls the time window displayed.
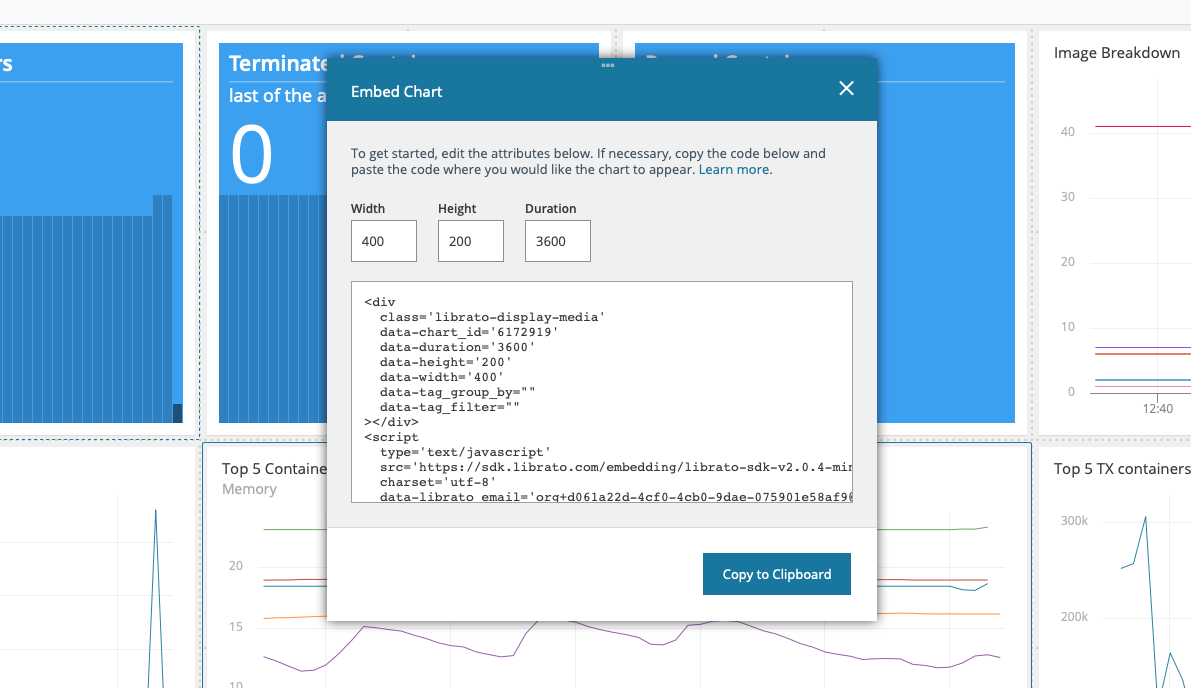
Once you are satisfied with the options, click in the copy to clipboard button, and paste the code snippet into your site’s source code.
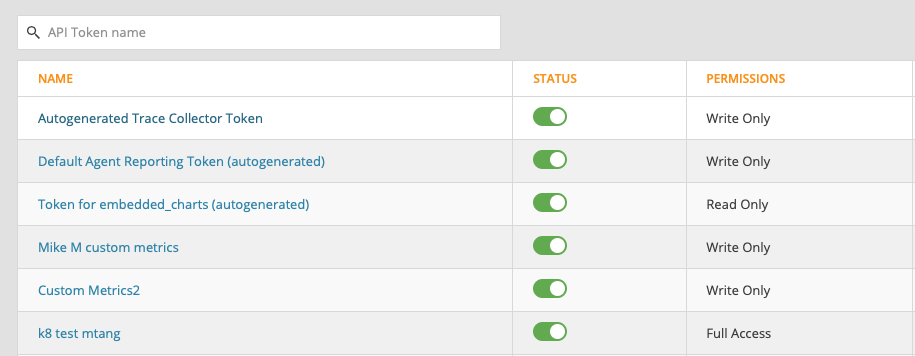
We use the same token for each of the embedded charts. To revoke it, visit the tokens page in account settings and look for the "Token for embedded charts":
Navigation Notice: When the APM Integrated Experience is enabled, AppOptics shares a common navigation and enhanced feature set with other integrated experience products. How you navigate AppOptics and access its features may vary from these instructions.