How to change the colors on a metric
AppOptics has a default color palette it assigns to series when rendering a chart. If you want to change the color of a series on a given chart, there are a couple of options available to you. All of them involve using our color picker to select a new color:
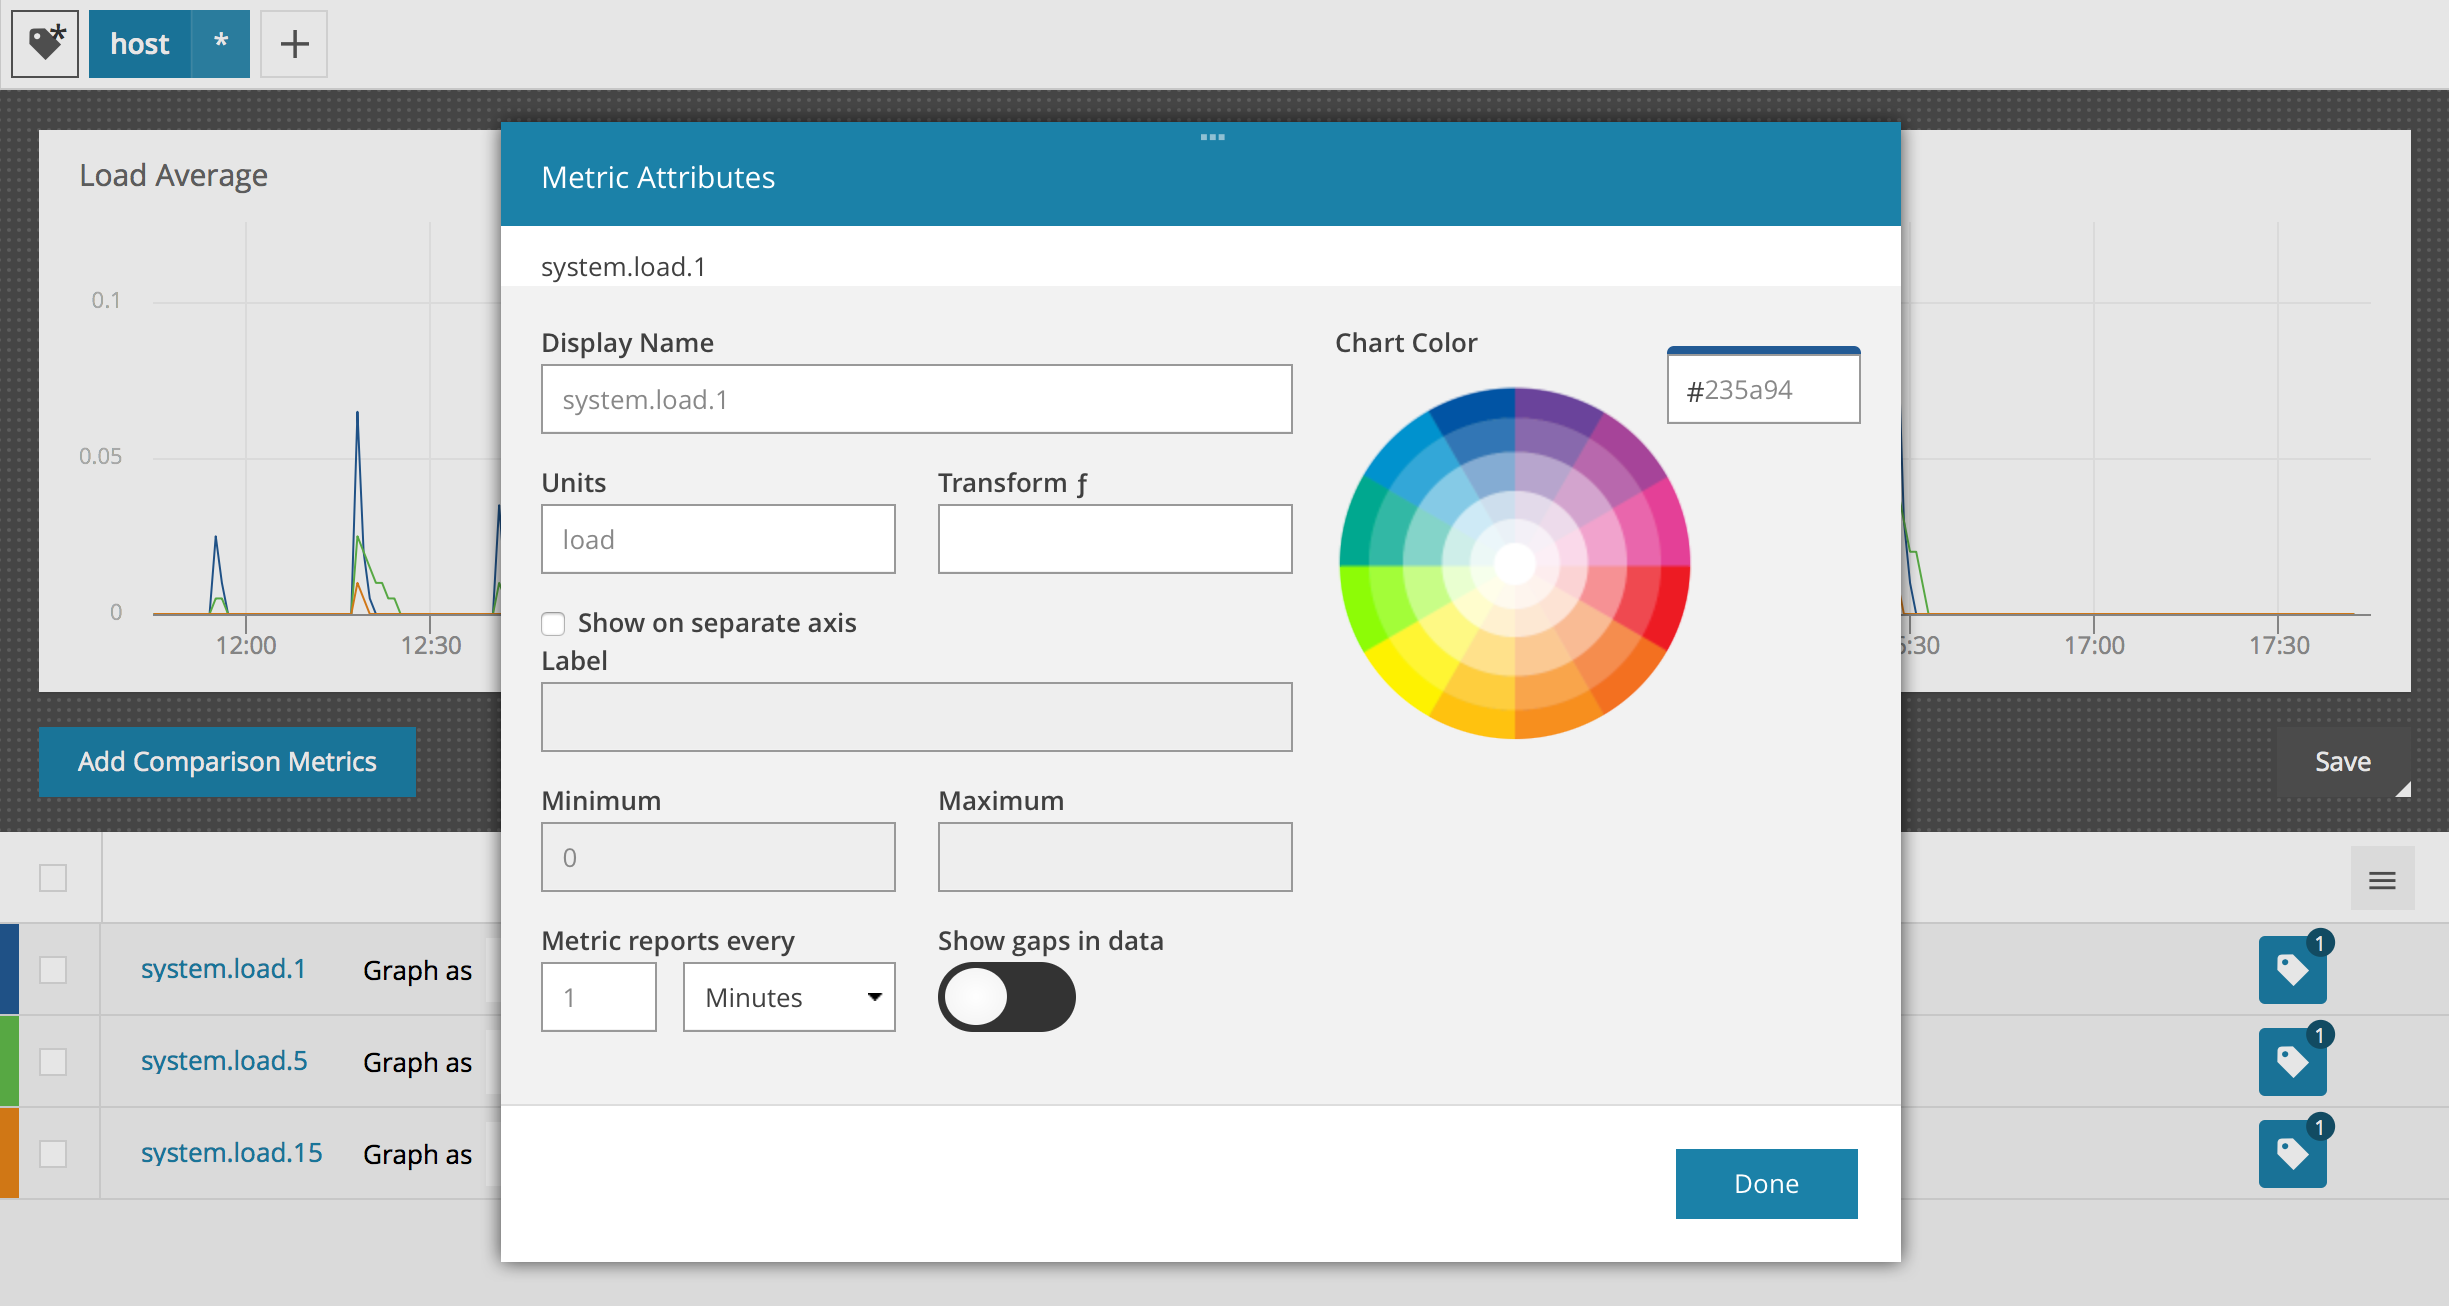
You can independently vary hue and brightness/saturation or just manually enter a hex code.
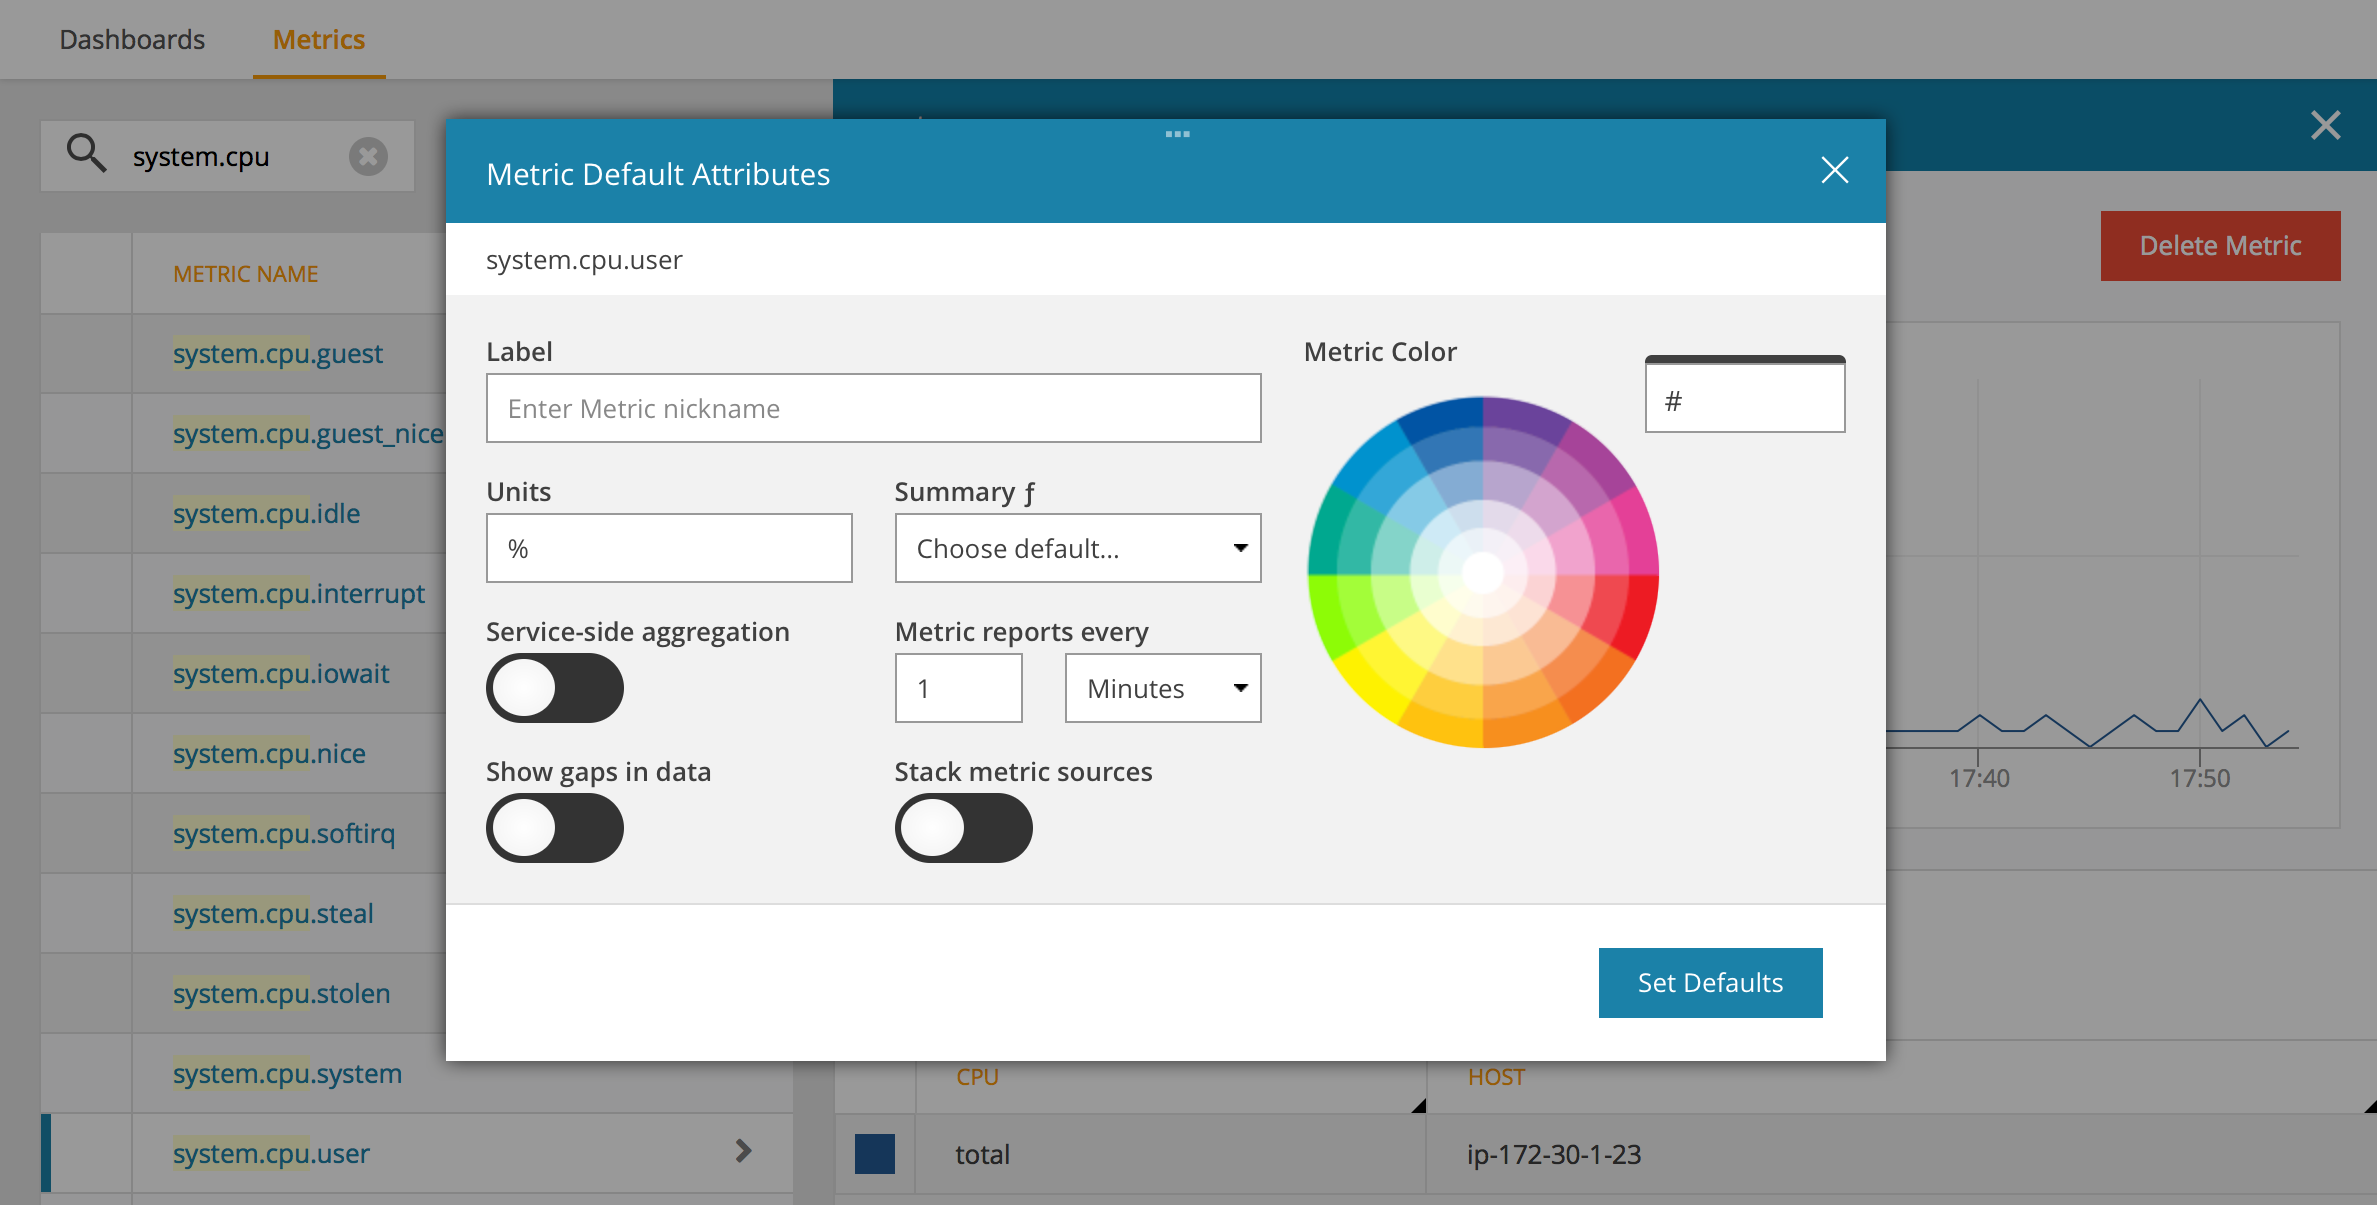
Configuring a Metric's Default Color
To set a metric's default color, click on the metric in the Metric view and then on the Set Default Attributes button.
When a color has been set on a metric, that color is used when rendering the metric as a line in any multi-metric chart. The color will also be used on the single metric chart if there is only one stream for the metric … if there are multiple streams, the chart is rendered with randomly assigned colors instead of using the same color for each series.
Special Case: Single Metric/Multiple Streams
Normally when a tag set for a single metric corresponds to multiple series on the chart, said series are all assigned the same color but with a different hue to distinguish them as a group from series defined by the other metrics. You can configure this color as described above. If there are no other metrics, there is no value gained from sharing the same color. In this situation we assign a random color to each series and the color picker is hidden. As soon as a second metric is added to the chart, colors are managed as described above.
Navigation Notice: When the APM Integrated Experience is enabled, AppOptics shares a common navigation and enhanced feature set with other integrated experience products. How you navigate AppOptics and access its features may vary from these instructions.