Viewing Traces
A trace is the path of a single request through an application. AppOptics gathers traces on a continuous basis and mines them for data, then makes them available in the UI filterable based on a number of criteria.
At a high level, traces are grouped by service (though a single trace can span multiple services), and you can find them under each service's Overview page.
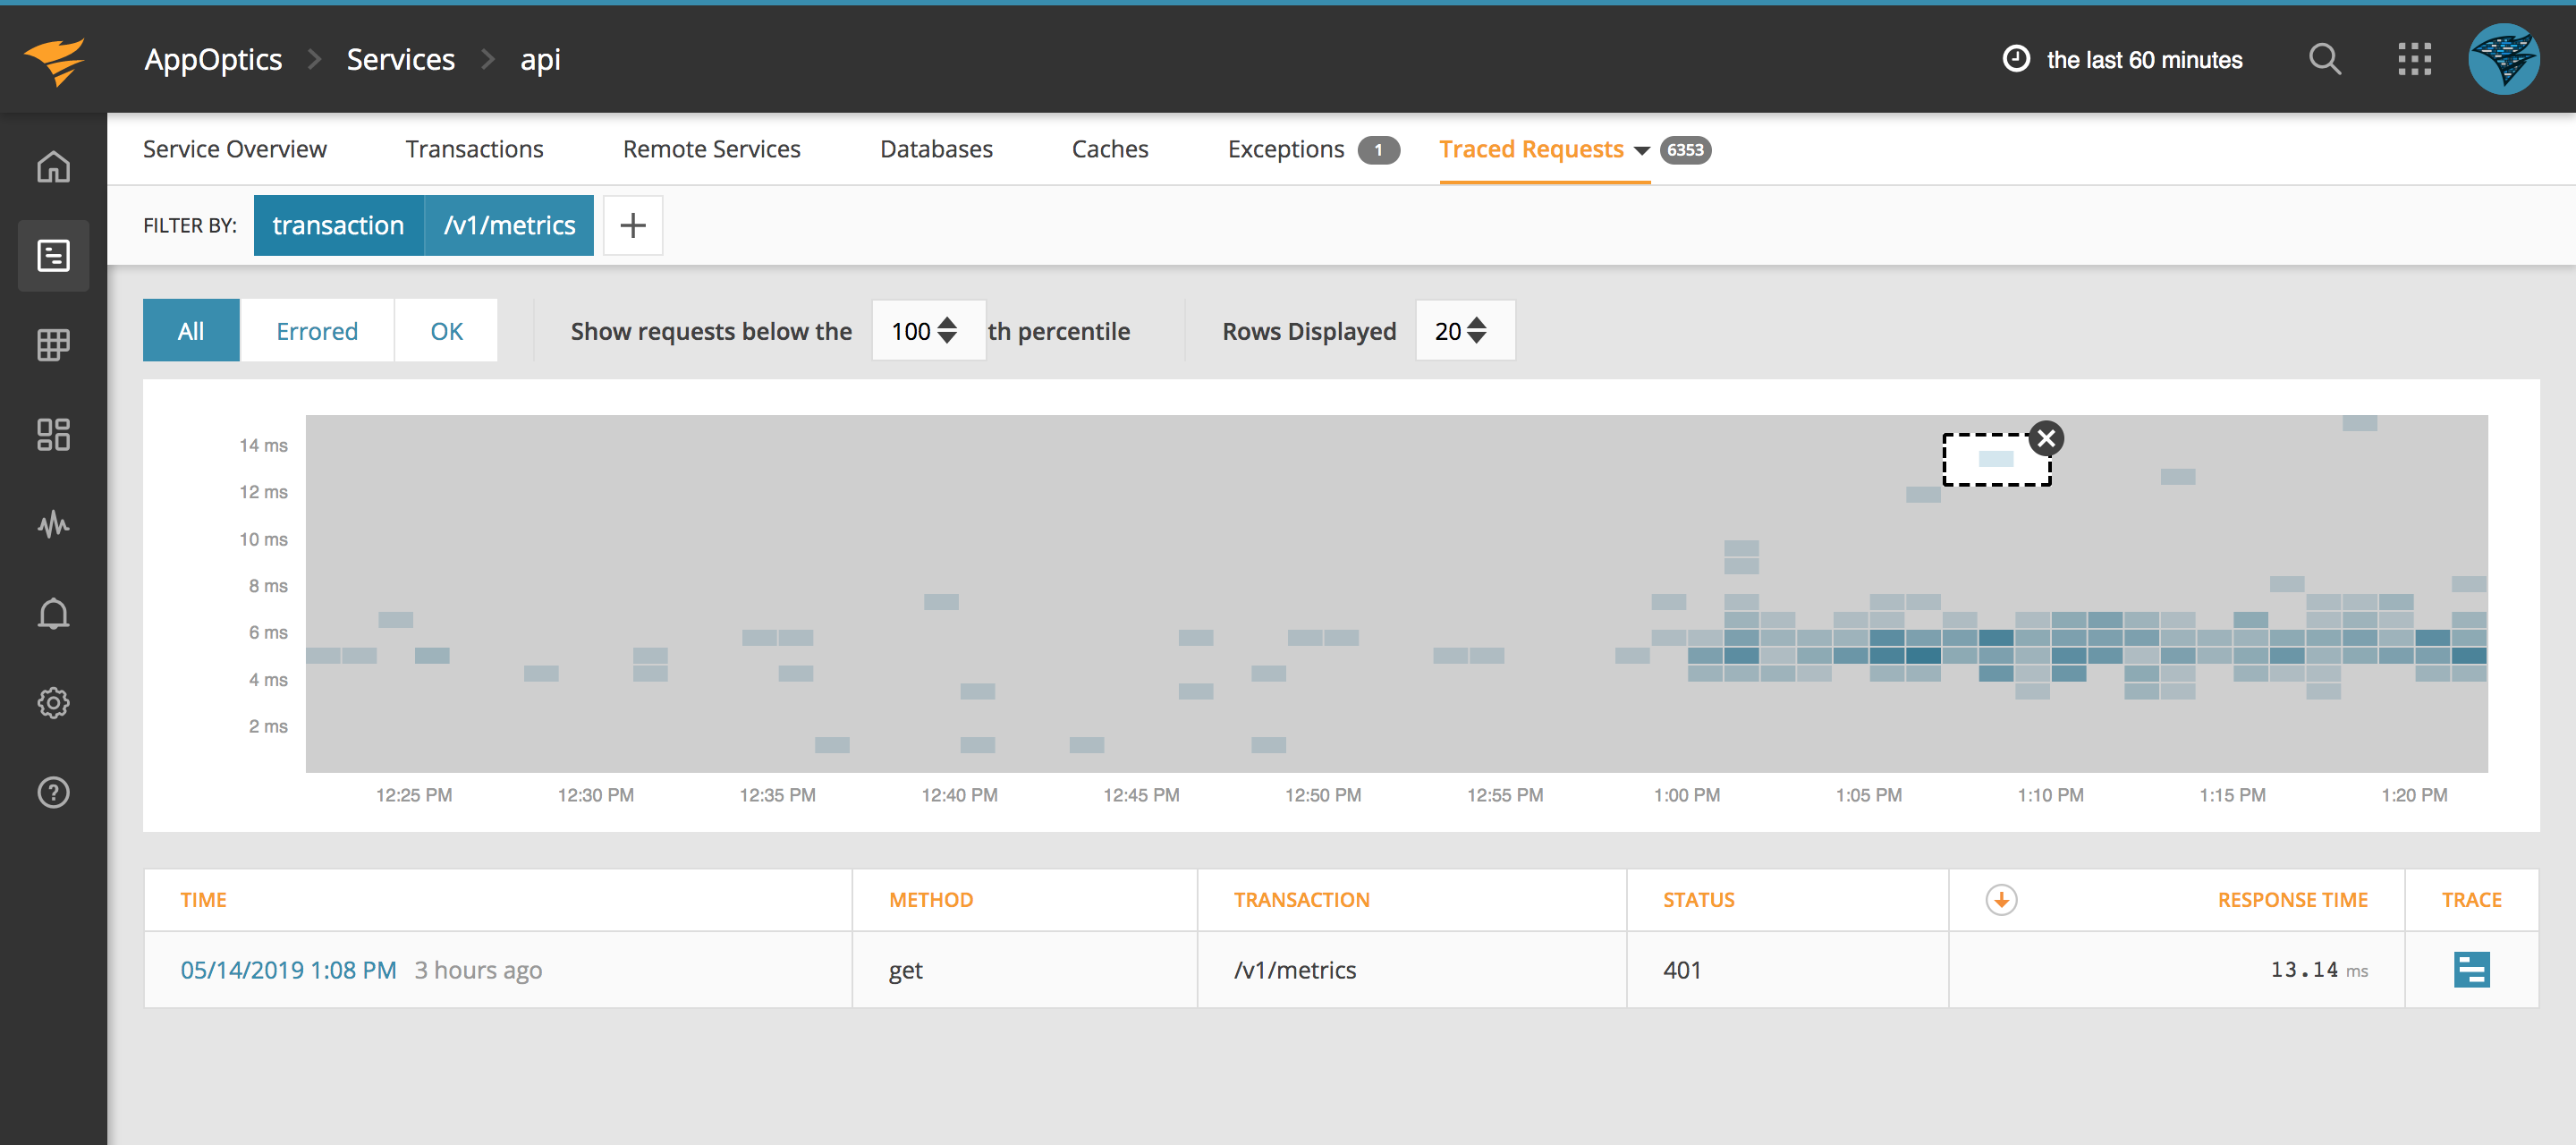
Trace Heatmap
The heat map chart shows a histogram of the request latency. The y-axis represents the request latency, and the color intensity of the chart represents the number of requests. The darker the color, the more requests. This chart type makes it easy to identify outliers. You can further adjust the chart to only show requests below certain percentiles and limit the number of rows displayed. To learn about specific traces you can click and drag your mouse around a specific request or group of requests on the chart. This will filter the list of traces beneath the chart to only show the ones in the area you selected.
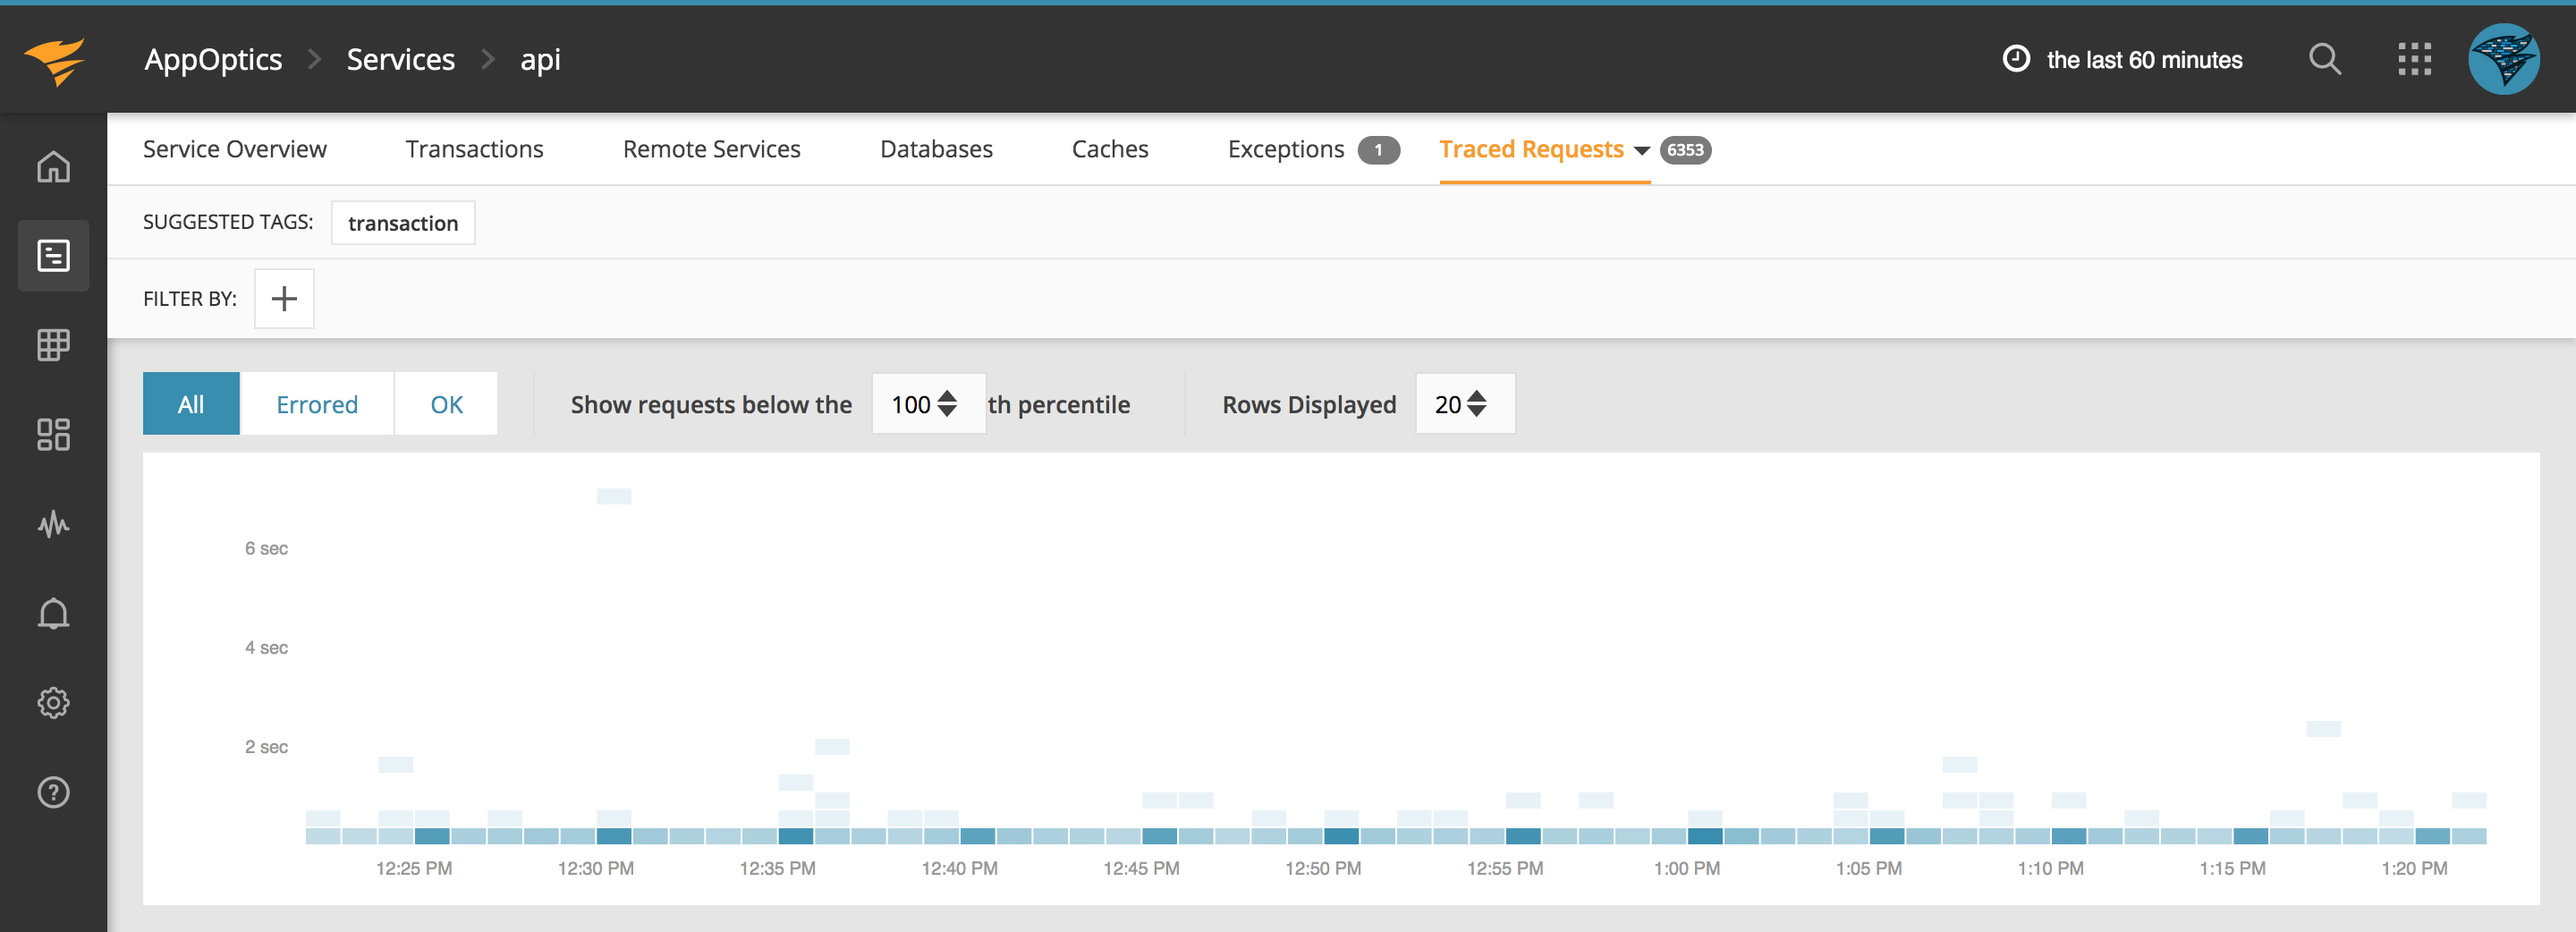
Searching for particular traces
Filtering: By using the Filter By feature you have the ability to filter by any of the suggested tags, e.g. drill down into a specific transaction.
Scope: By default, we show the Traced Requests–traces of requests to the service in question. If you hover over Traced Requests you will see a dropdown menu that allows you to switch to database queries, remote service calls, or cache calls.
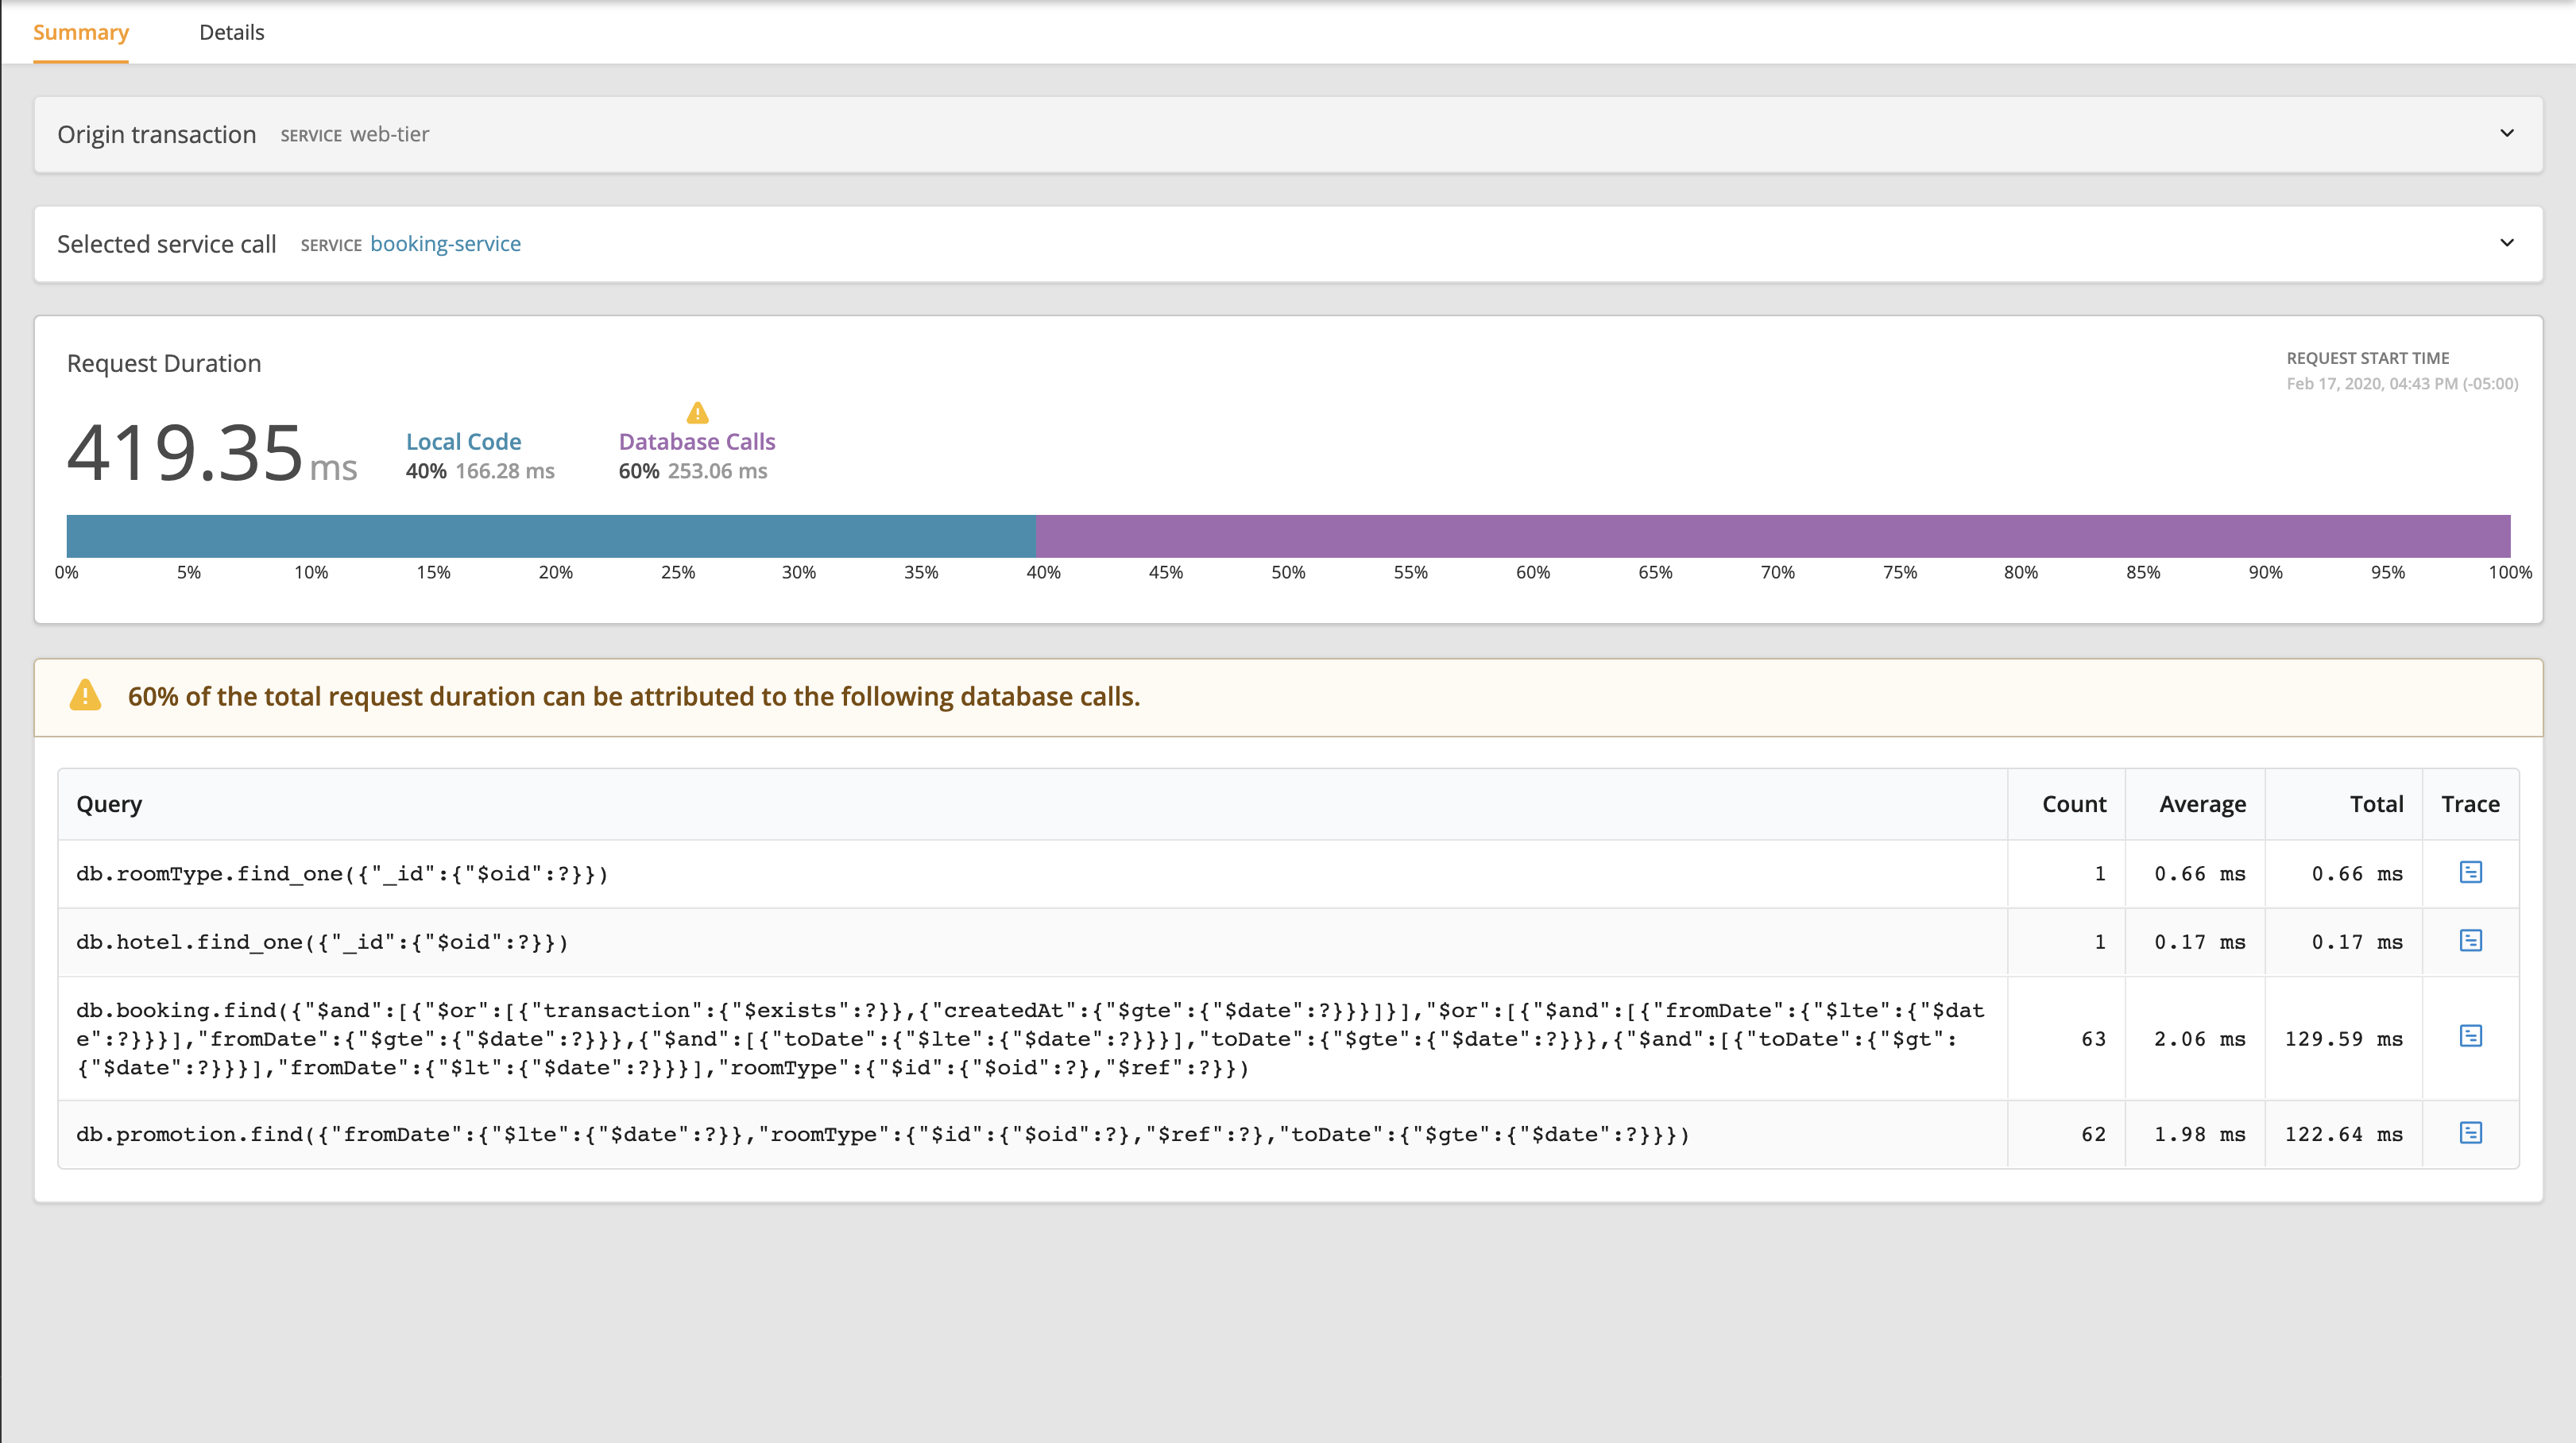
Trace Summary
When you first navigate to a particular trace, you will be taken to the Summary tab. This is a good place to start if you want to just get a quick idea of where most of the time is being spent for a request.
The trace summary automatically evaluates a transaction and highlights where the service is spending most of its time. For example, if a particular transaction is mostly waiting on queries, that will be highlighted and you'll get a summary of the specific queries. If the transaction is slowed down by a downstream service or external API calls, that's covered too. If you're instrumenting custom code in your application, the new summary page paired with live code profiling will even tell you which function was slow.
Trace Details
A single trace could be as simple as a single span on a web server hosting static content, or as complex as the path through a load balancer into one of many app servers, through to an API call, and back again. For those more complicated requests, if you wish to take a deeper dive into analyzing your application performance, waterfall-type views are available in the Details tab.
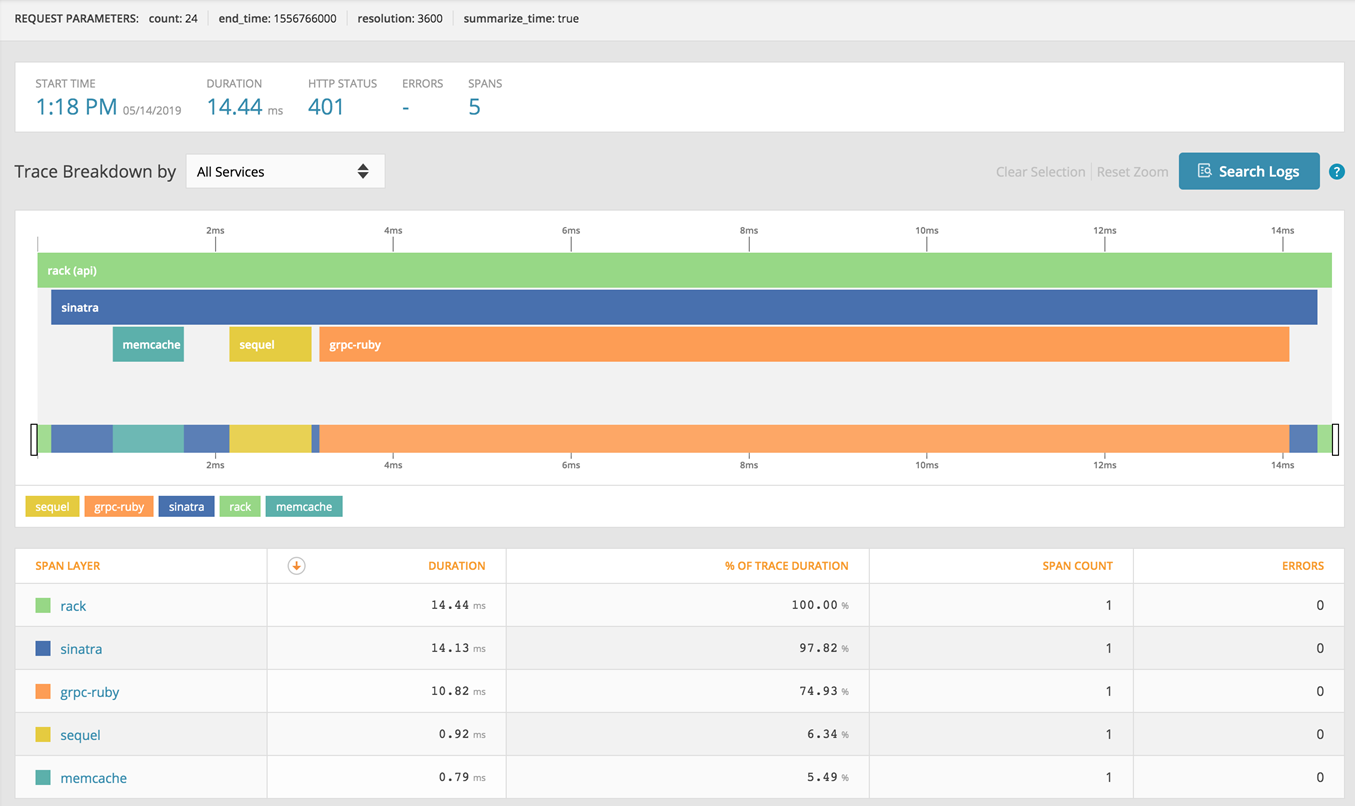
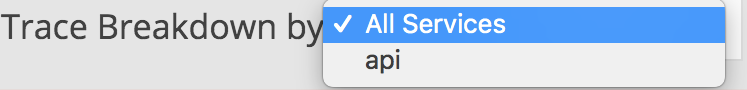
As previously noted, traces can span across multiple services. You can view the details for this trace within a specific service by using the Trace Breakdown by dropdown. In this example, the only service this trace interacts with is api.
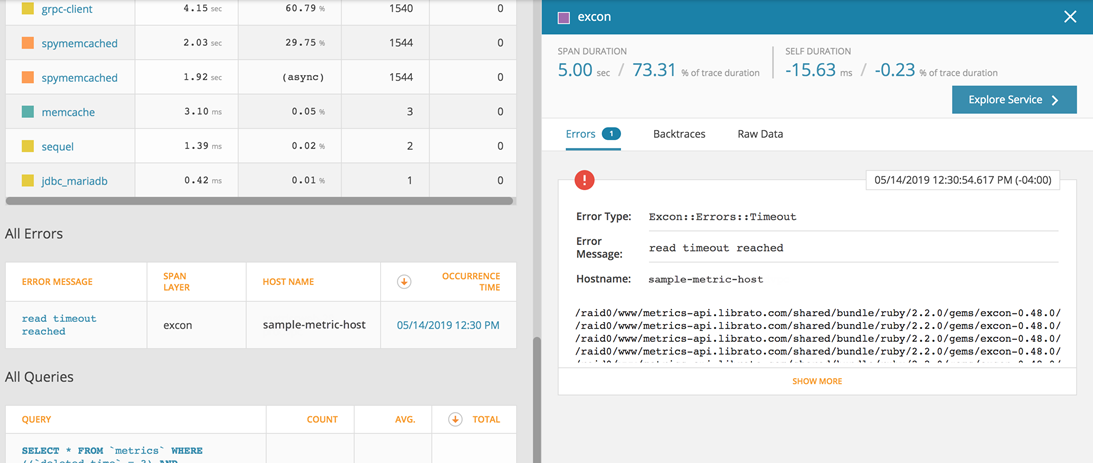
Clicking on a span in the chart opens up a detail window on the right. In the example below, the sequel span was selected, which is a Ruby library being used by this application to query a database. The detail window shows information from the database name right down to the query that was executed.
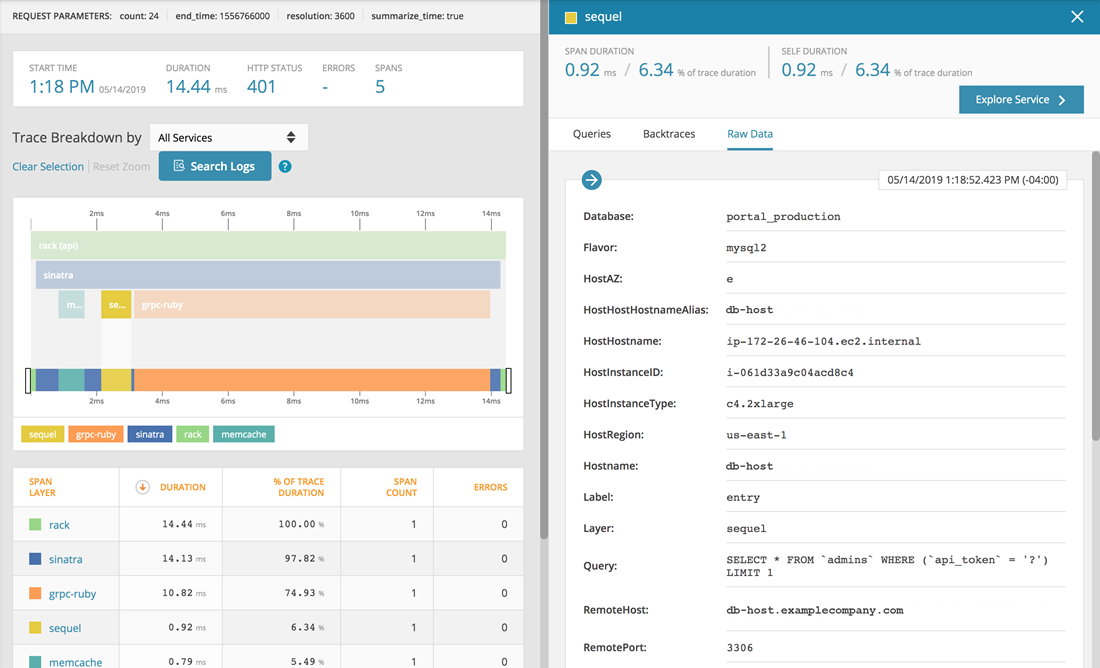
The tables below the visualization are also interactive: clicking a row in the table will pull up details about the relevant span(s) in the right-hand panel.
If any errors occur during the duration of the trace, they will be displayed in the All Errors table. Opening the detail window for a span shows high-level information about the errors, including a link to the full backtraces. In the example below, the insertworker span is a Python process that threw a ConnectionError exception.