Exception Handling
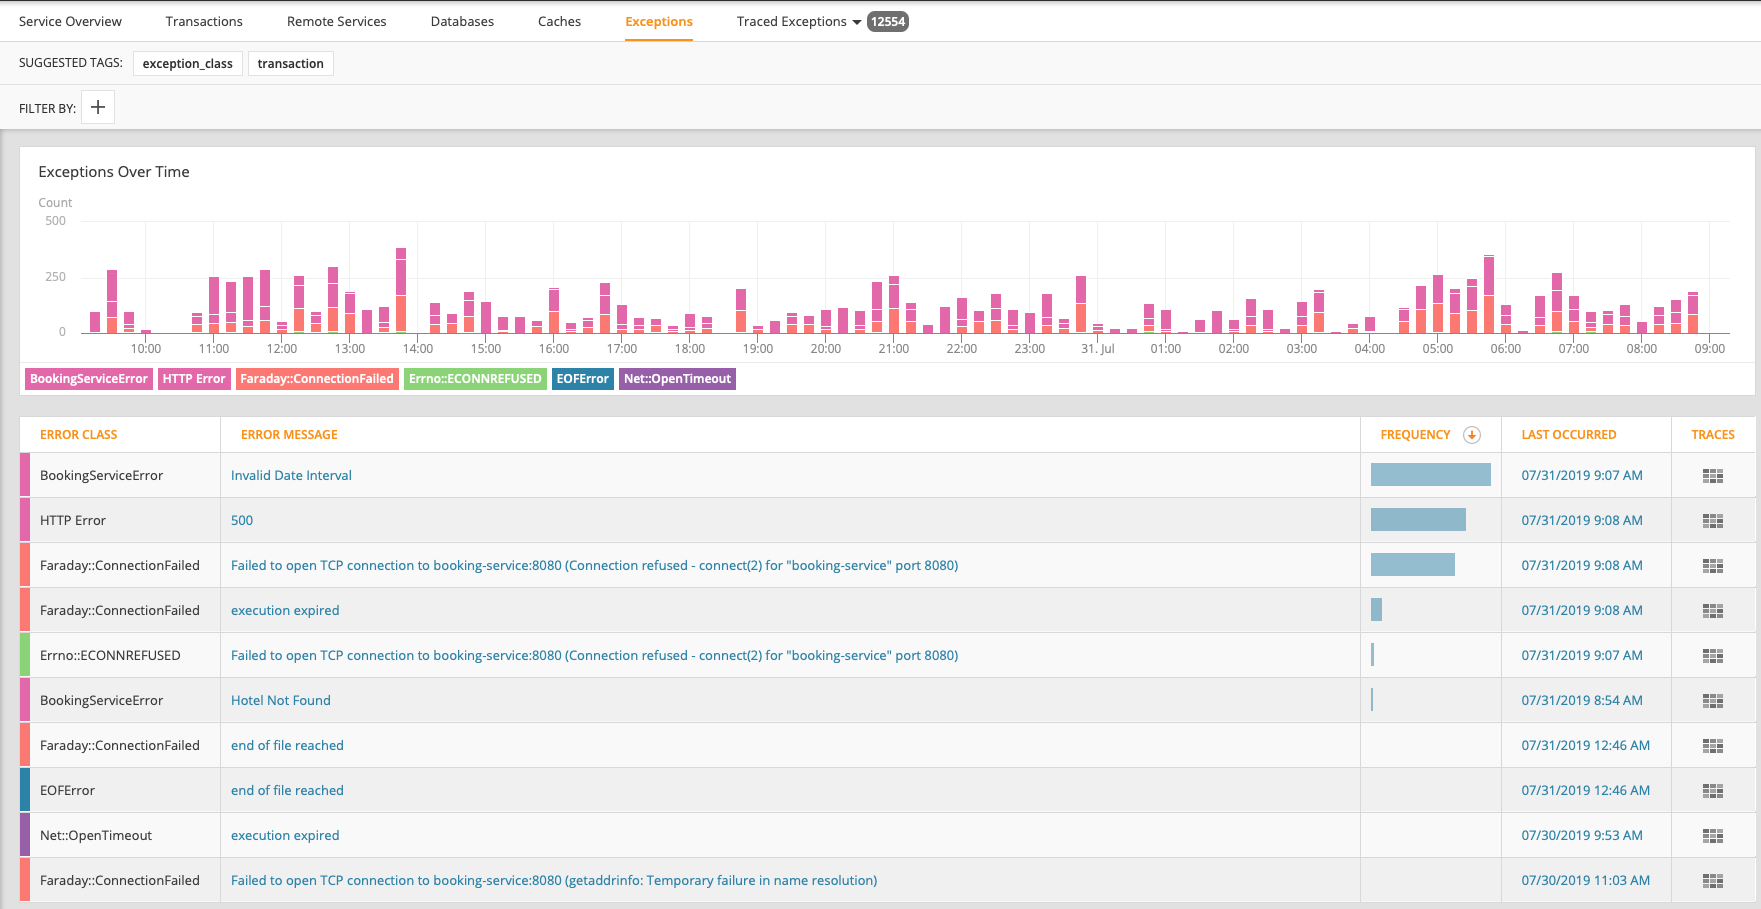
The exceptions tracking feature builds on top of AppOptics' automatic tracing capability, providing a summary of exceptions happening within a service context. When troubleshooting a service, simply click on the exceptions tab at the top of the page to understand the current volume of exceptions, when they started, and which exceptions are most frequent. You can even drill into each exception, viewing the stack trace, and which endpoints in the application are throwing them.
Exceptions in distributed services
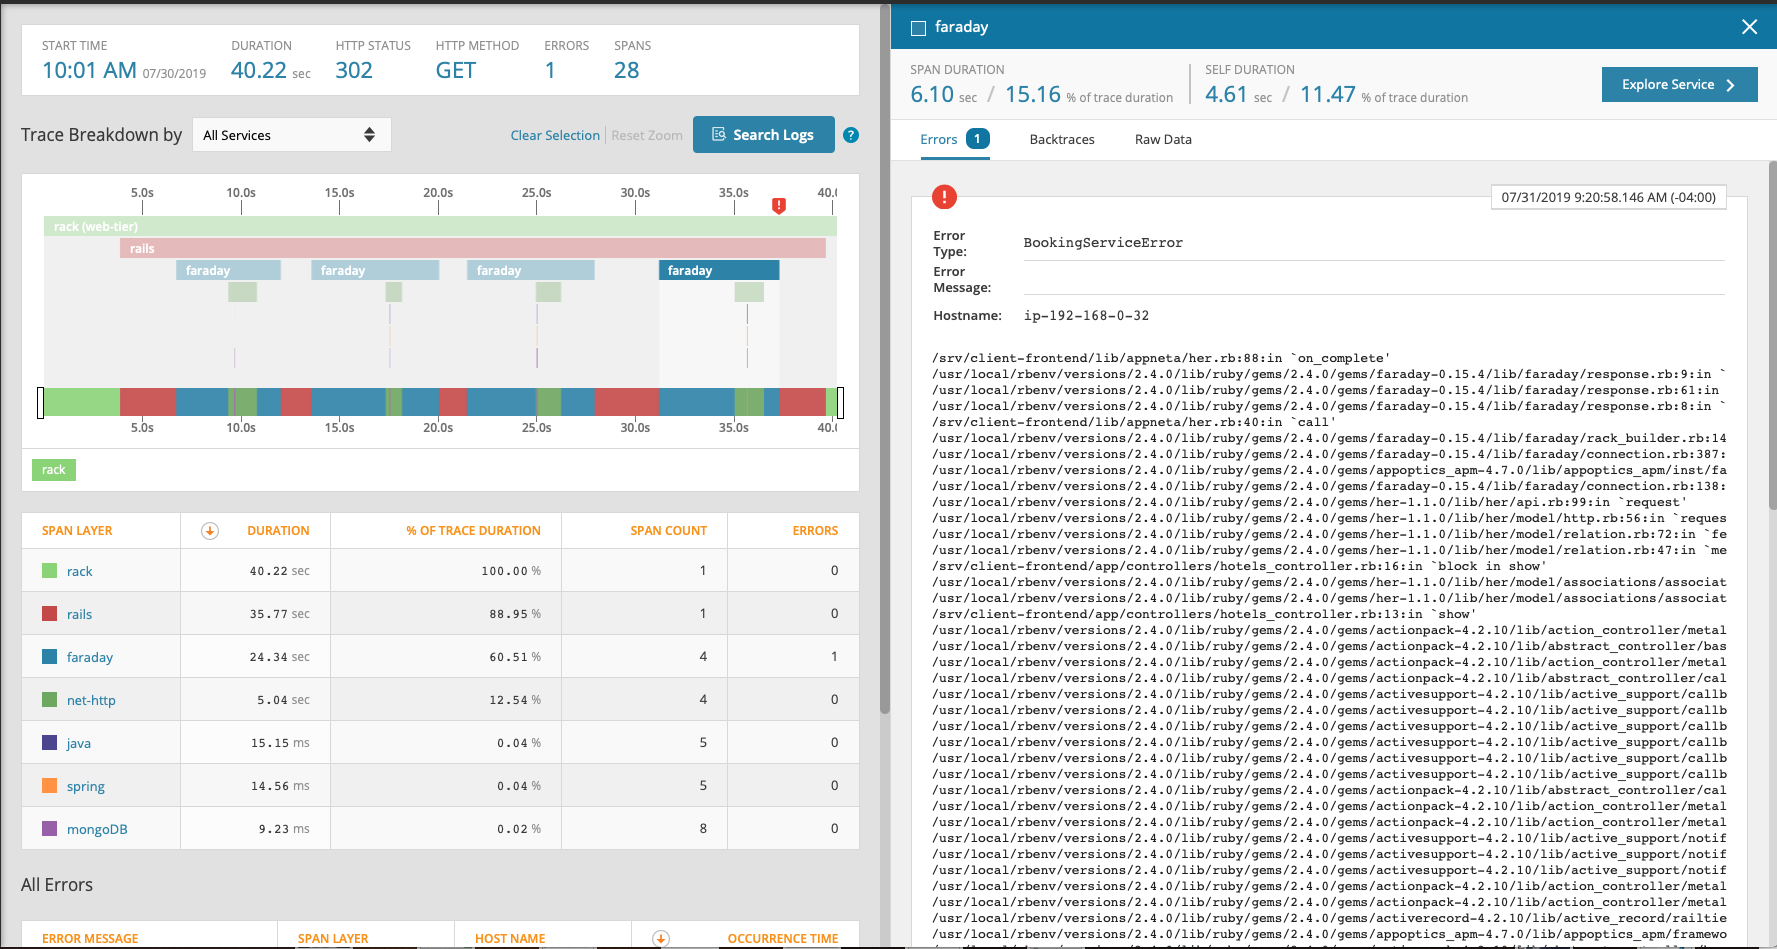
If it's 3am and you just got paged, you likely want to know the scope of an issue, to understand whether it needs to be resolved immediately. AppOptics exception tracking enables you to drill down from a summary of exceptions, to viewing a specific exception in the context of a distributed trace. Simply click on ‘last occurred' to bring up a specific example of where in the system this exception was thrown, and if it propagated to upstream tiers.
Exceptions related to infrastructure
If a service is throwing exceptions such as thread exhaustion or disk I/O messages, the next logical step is to look at the
health of the underlying infrastructure. AppOptics enables you to quickly jump from a service context to the infrastructure context
running that service. The next time you see a scary thread pool exhausted error, you can quickly understand how you arrived at
that state, and have the information available to right size the infrastructure behind it.
Enabling
All AppOptics accounts now have access to exception tracking and all the latest APM agents support the functionality.
Navigation Notice: When the APM Integrated Experience is enabled, AppOptics shares a common navigation and enhanced feature set with other integrated experience products. How you navigate AppOptics and access its features may vary from these instructions.