Custom Instrumentation
The following content pertains to custom instrumentation for the legacy AppOptics agents.
AppOptics agents are no long receiving updates. The new SolarWinds Observability libraries can send APM data in AppOptics and are regularly updated with new features and improvements. If you are still relying on the AppOptics agents and your components are supported by the new libraries, consider transitioning to the SolarWinds Observability libraries for your APM needs. Alternatively, you can use SolarWinds Observability as your primary APM solution.
If you have already transitioned to the new SolarWinds Observability libraries, see the SolarWinds Observability APM Services documentation for custom instrumentation information.
SolarWinds Observability libraries are not compatible with AppOptics agents. Do not use a mix of SolarWinds Observability libraries and AppOptics agents to instrument applications that are part of a distributed trace.
Custom instrumentation can be used to get extra application-specific visibility in AppOptics. Overall, there are numerous options for providing custom data including statsd, our REST API, and other plugins. However, in an APM-instrumented application the language SDK methods provided by the agent can be the simplest and most performant ways to get additional visibility. The SDK methods can be used to log more details as spans on a traced request, and report custom timer/counter metrics.
Custom spans for distributed tracing
AppOptics traces are formed of spans tracking service execution and data logged along the way. The APM agents log spans for key application and language features out of the box, including most common frameworks and libraries.
However, it's quite simple to add custom span instrumentation in your favorite language, for instance:
import appoptics_apm
@appoptics_apm.log_method('slow_thing')
def my_possibly_slow_method(...):
...
What does that log_method decorator do? Read on for a quick anatomy of spans.
Primer: spans
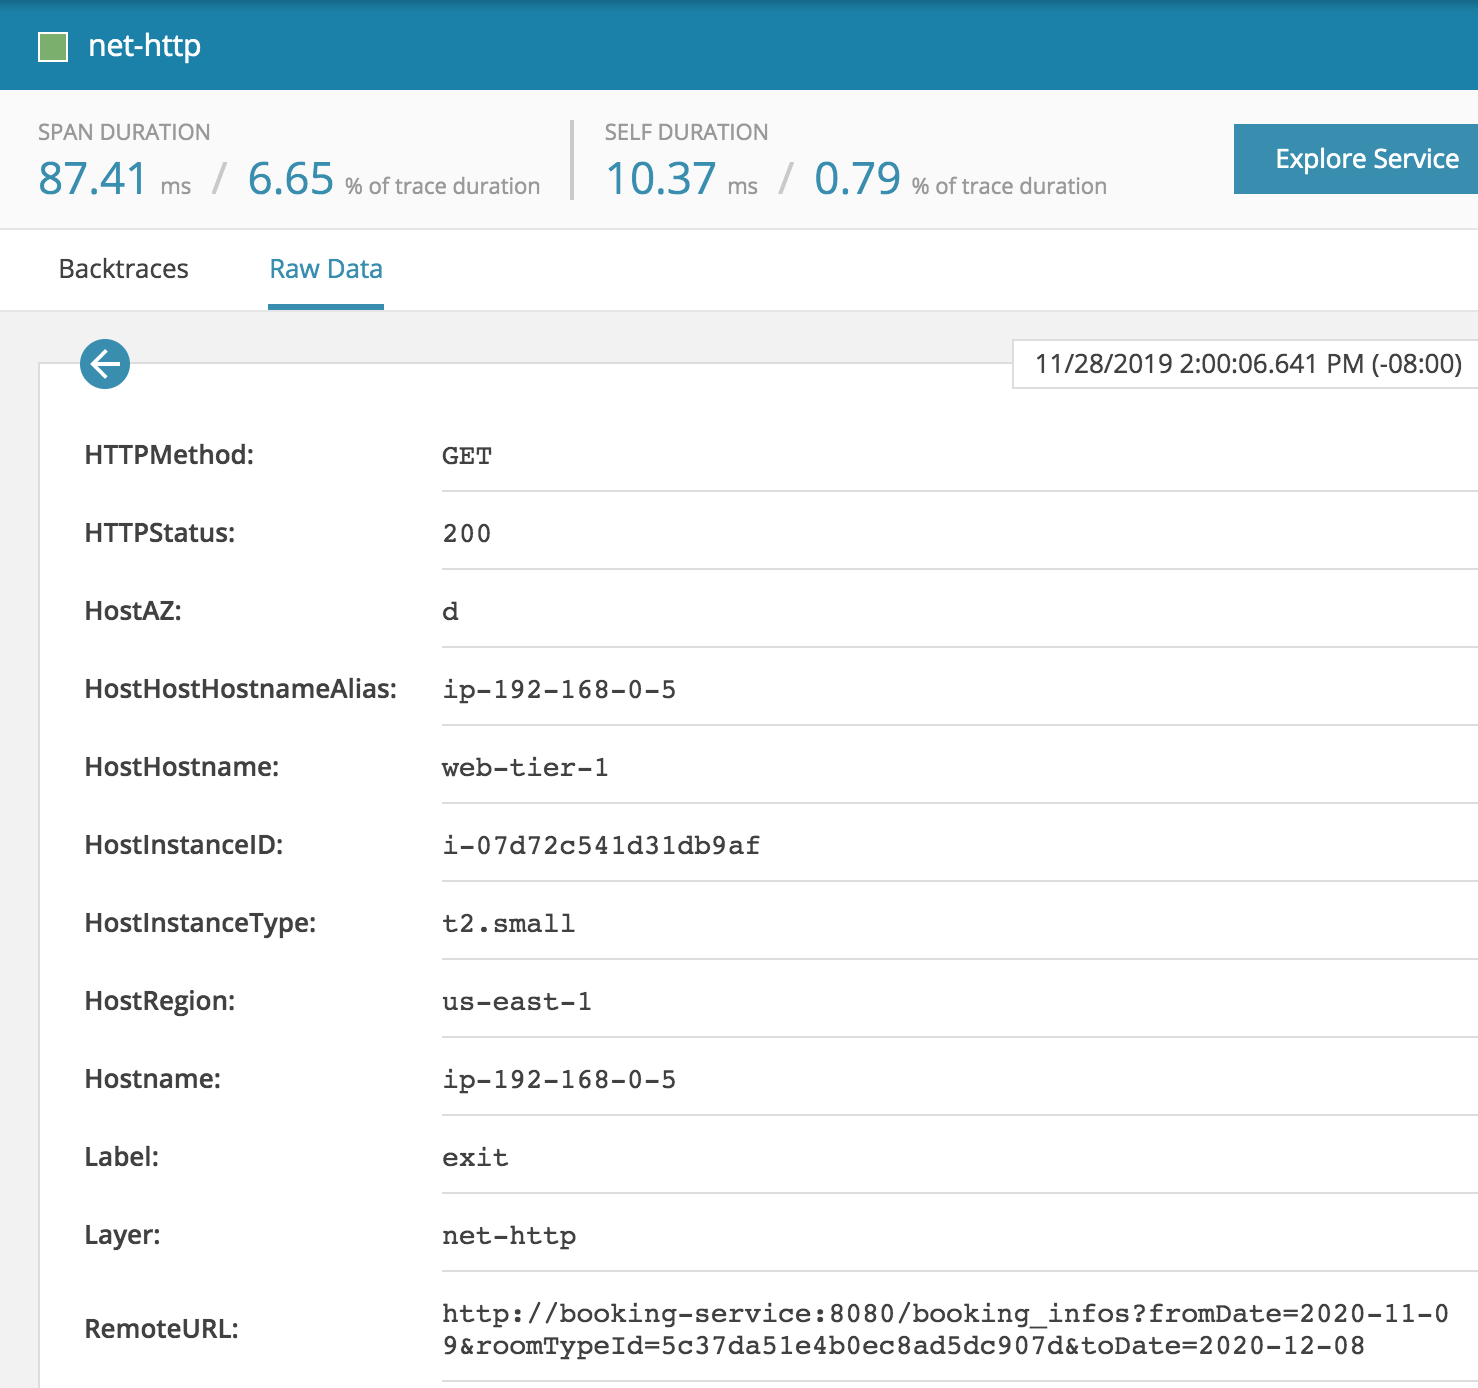
All agent SDK calls, whether exposed as annotation, decorator or function, essentially create events which are the building blocks of a span, which in turn build a trace. An event can be represented as a set of key-value (KV) pairs; this is displayed in the Raw Data when you click on a span in the Trace Detail. An example is shown below, note that certain KVs such as those keyed by Host* are automatically added during trace processing so should not be set in the SDK call.
Details: events, spans and traces
An event is a set of KV pairs which records a point in the execution flow of a request through the application. There are four types of events as defined by the Label KV:
entryandexitare used to begin and end a spaninfois used to log more information into a particular spanerroris used to log errors/exceptions
A pair of entry and exit events form a span which captures timing and other important data about a particular operation in the application.
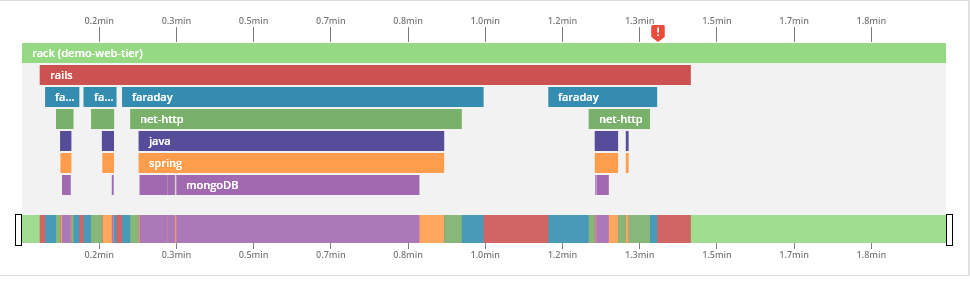
A collection of linked spans form the trace which shows the entire flow and performance of a request (aka transaction) as it traverses the components and distributed systems in the application.
Spans are usually linked automatically by agent's context tracking. There could be some edge cases that explicit context propagation is necessary by using SDK calls. Refer to each language agent SDK for details.
Each trace has a root span which is not linked to any parent span, and represents both the entire transaction and its entry point into the application.
The SDK annotations, decorators and higher level span-specific functions take care of creating the underlying events to form a span. However, when using lower level SDK calls that create a single event, you must ensure that the calls are made in the proper order and set the expected KVs to generate the matching entry and exit required for a span. The rules are as follows:
- The first SDK call marking entry into a new span must set Label to
entryand Layer to a descriptive span name. - The final SDK call marking exit from the span must set Label to
exitand Layer to the same span name as the entry event. - A span can have any number of intervening events (most commonly
infoanderror) between the entry and exit. SolarWinds recommends that you explicitly set Layer to the same span name as the entry event; if unset, it defaults to the name of the current span. - A span can have nested sub-spans.
Special span types
How does AppOptics decide whether a span is a database query, a remote service call, or just part of an application? Trace processing interprets the KVs reported on a span, using the set of rules specified below, so that certain spans receive special treatment. Spans that do not fit these rules will still be processed but categorized as generic spans.
The KV pairs can be set in any of the entry, info or exit events of the span.
The required KVs must be set for a span to be recognized as a particular type, while optional KVs provide additional information that enhance AppOptics trace processing and analytics.
Cache
Cache represents the operations against key-value stores such as Memcached and Redis.
| Key Name | Value Type | Required | Description |
|---|---|---|---|
| Flavor | string | yes | The cache type memcache, redis, etc. |
| KVOp | string | yes | The type of operation get, set, etc. |
| RemoteHost | string | yes (if no RemoteHostPool) | The hostname or IP of the remote host connected to for this operation. |
| RemoteHostPool | array | yes (if no RemoteHost) | A list of the hostnames or IPs that are part of the pool being used. |
| Spec | string | yes | Must be cache. |
| KVHit | boolean | no | Whether the get operation was a hit/miss. |
| KVHitCount | integer | no | For multiget operations, the number of hits from requested keys. |
| KVKey | string | no | Key name being operated on. This should be a single value, omit if there are multiple keys. |
| KVKeyCount | integer | no | For multiget operations, the number of keys requested. |
Controller action
MVC controller and action information can be associated to the transaction by adding these KVs to the root span of the trace as either:
- an individual event with Label
infoand the required KVs, or - for compactness, the required KVs bundled into the entry or exit event of the root span
| Key Name | Value Type | Required | Description |
|---|---|---|---|
| Action | string | yes | Name of the action, truncated at 40 UTF-8 characters. |
| Controller | string | yes | Name of the controller, truncated at 40 UTF-8 characters. |
Database
Operations against a variety of SQL and NoSQL databases are represented by the database span.
| Key Name | Value Type | Required | Description |
|---|---|---|---|
| Flavor | string | yes | The type of database being accessed mongodb, oracle, postgresql etc. |
| Query | string | yes | The query text; if this is longer than 2048 bytes it should be truncated. |
| RemoteHost | string | yes (if no RemoteHostPool) | The hostname or IP of the remote host connected to for this operation. |
| RemoteHostPool | array | yes (if no RemoteHost) | A list of the hostnames or IPs that are part of the pool being used. |
| Spec | string | yes | Must be query. |
| Database | string | no | The name of the database being used. |
| QueryTruncated | boolean | no | Whether the Query has been truncated. |
| QueryArgs | array | no | An array that contains the query parameters set for prepared statements. This should be a list-style array if possible, but can be a dictionary/map-style array if necessary based on argument parameterization. |
Error
Error/exception is not strictly a span, since it is a point-in-time occurrence that should be reported as either:
- an individual event with Label
errorand the required KVs, or - for compactness, the required KVs bundled into the entry or exit event of the span in which the error occured
| Key Name | Value Type | Required | Description |
|---|---|---|---|
| Label | string | yes (if outside of a span) | Must be error. |
| ErrorClass | string | yes | The type of error. |
| ErrorMsg | string | yes | A more specific error message. |
| Layer | string | no | Name of the span at the point of error/exception. |
Remote service
This represents a call to a remote service via RPC/HTTP transport.
| Key Name | Value Type | Required | Description |
|---|---|---|---|
| IsService | boolean | yes | Must be set to true. |
| RemoteURL | string | yes | The requested URI, e.g. https://api.appoptics.com/v1/measurements/my.custom.metric?duration=300. |
| Spec | string | yes | Must be rsc. |
| HTTPMethod | string | no | The HTTP method used such as GET, POST, etc. |
| HTTPStatus | string | no | The HTTP status code returned. |
Server/application entry point
This is the start, or root span, of each trace and represents the point where a transaction first enters the service. In a distributed architecture the trace may cross multiple services and thus have multiple entry point spans; this is possible because a unique trace context is created for the transaction upon entry into the first service. Whenever execution flow leaves the current process, for example via an RPC call, the trace context must be propagated in the call (in many cases as an X-Trace header), and the entry point of the downstream service must look for and continue an incoming trace context.
The APM agents automatically instrument most HTTP-based entry and exit points, so you should seldom need to use the SDK to create the span types described below. If you do need to use the SDK to start a trace, note that there are specific calls provided by each language agent such as .NET's Trace.StartTrace() and Trace.ContinueTrace() that should be used in order to propagate any incoming Trace ID.
Note also that each language agent SDK provides a way to set a custom transaction name on the trace, which is automatically added to the root span as the TransactionName KV.
Web server
This represents an HTTP server entry point into the application.
| Key Name | Value Type | Required | Description |
|---|---|---|---|
| HTTP-Host | string | yes | The domain name of the server, and (optionally) the port number on which the server is listening., e.g. Host header of the request, www.appoptics.com. |
| HTTPMethod | string | yes | The HTTP request method GET, POST, etc. |
| Spec | string | yes | Must be ws. |
| Status | integer | yes | The HTTP response status code, e.g. 200, 404, etc. |
| URL | string | yes | The URL portion after domain name and port, typically the path to the resource and any query parameters, e.g. value of the REQUEST_URI server variable. |
| ClientIP | string | no | Client IP address, e.g. value of the REMOTE_ADDR server variable. |
Custom timers/counters for metric reporting and alerting
Custom metrics allow timing and counters/gauges for use in dashboarding and alerting:
long startTime = System.currentTimeMillis();

// some work here...

long duration = System.currentTimeMillis() - startTime;
Metrics.summaryMetric("my-work-duration", duration, tags);
Metrics.incrementMetric("my-work-count", tags);
There are also a number of other ways to provide custom metrics including statsd, our REST API, and other plugins.
Language SDKs
The APM agent SDK provides support specifically tailored to the conventions of each language:
Navigation Notice: When the APM Integrated Experience is enabled, AppOptics shares a common navigation and enhanced feature set with other integrated experience products. How you navigate AppOptics and access its features may vary from these instructions.
The scripts are not supported under any SolarWinds support program or service. The scripts are provided AS IS without warranty of any kind. SolarWinds further disclaims all warranties including, without limitation, any implied warranties of merchantability or of fitness for a particular purpose. The risk arising out of the use or performance of the scripts and documentation stays with you. In no event shall SolarWinds or anyone else involved in the creation, production, or delivery of the scripts be liable for any damages whatsoever (including, without limitation, damages for loss of business profits, business interruption, loss of business information, or other pecuniary loss) arising out of the use of or inability to use the scripts or documentation.