Create and edit reports
 Check out this video (8:58) on best practices for creating custom reports.
Reports can show statistics and aggregated data (such as totals or averages). They can also represent data graphically (as bar charts and pie charts) to help you compare groups of tickets or assets.
Reports display information about tickets, assets, and billing. They are useful for showing the total or average value of one type of item in relation to a second type of item. Examples include:
- How many tickets did each tech close?
- How many tickets were opened against each asset?
- How many assets are checked out in each location?
- What is the average work time per ticket request type?
- How many tickets were opened against each request type?
Reports can be displayed in the web interface or generated in PDF format. You can also create schedules to automatically run reports and email them to groups of recipients.
From any report, you can click the ticket or asset total to display detailed information about the items included in that total.
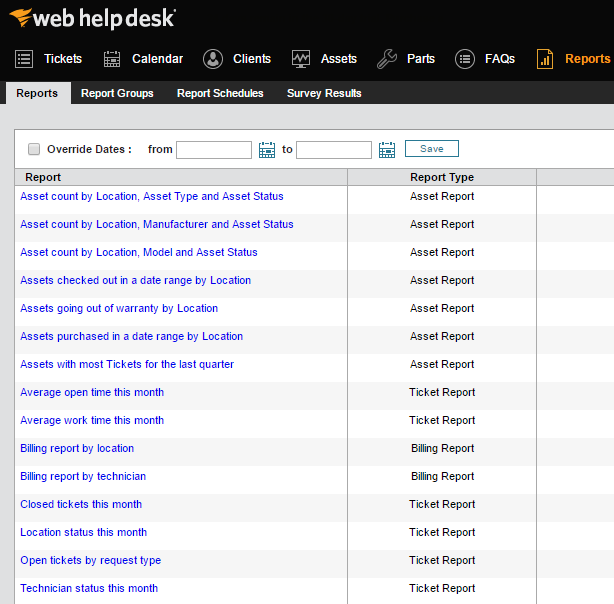
The Reports screen includes a list of predefined reports that focus on asset, billing, and ticket information. You can also create composite reports that link together a mixture of reports. Each report can include charts or tables that display the number of items in possible categories.
Click Reports in the toolbar to access the Reports screen.
Sample reports
Using sample reports included with Web Help Desk, you can create asset and ticket reports to help you monitor technician performance, customer support needs by location, and incidence frequency. Using additional features incorporated into reports, you can categorize reports into report groups, generate survey results, and schedule automated reports for distribution.
After you create a report, you can view and download the report, modify the report, or change the bar and pie chart configuration options.
Listed below are the types of reports you can create in Web Help Desk.
| Report type | Description |
|---|---|
| Asset report |
Reports details about multiple types of assets in your organization, such as:
|
| Ticket report | Reports on data collected in customer tickets. You can create a ticket report that includes a bar chart, pie chart, or table-only reports. |
| Ticket billing report | Reports the total work time, parts cost, and labor cost accrued for a set of tickets. |
| Custom report |
Reports on specific items you select in the Web Help Desk Administrator Console. |
| Average ticket time report | Reports the average amount of time in a Web Help Desk environment for a ticket to move from Open To Closed status. |